Advance Auto Parts 2009 Annual Report Download - page 95
Download and view the complete annual report
Please find page 95 of the 2009 Advance Auto Parts annual report below. You can navigate through the pages in the report by either clicking on the pages listed below, or by using the keyword search tool below to find specific information within the annual report.-
 1
1 -
2
-
3
-
4
-
5
-
6
-
7
-
8
-
9
-
10
-
11
-
12
-
13
-
14
-
15
-
16
-
17
-
18
-
19
-
20
-
21
-
22
-
23
-
24
-
25
-
26
-
27
-
28
-
29
-
30
-
31
-
32
-
33
-
34
-
35
-
36
-
37
-
38
-
39
-
40
-
41
-
42
-
43
-
44
-
45
-
46
-
47
-
48
-
49
-
50
-
51
-
52
-
53
-
54
-
55
-
56
-
57
-
58
-
59
-
60
-
61
-
62
-
63
-
64
-
65
-
66
-
67
-
68
-
69
-
70
-
71
-
72
-
73
-
74
-
75
-
76
-
77
-
78
-
79
-
80
-
81
-
82
-
83
-
84
-
 85
85 -
 86
86 -
 87
87 -
 88
88 -
 89
89 -
 90
90 -
 91
91 -
 92
92 -
 93
93 -
 94
94 -
 95
95 -
 96
96 -
 97
97 -
 98
98 -
 99
99 -
 100
100 -
 101
101 -
 102
102 -
 103
103 -
 104
104 -
 105
105 -
106
-
107
-
108
-
109
-
110
-
111
-
112
 |
 |

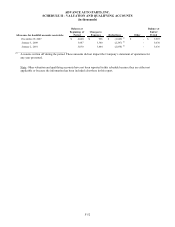
ADVANCE AUTO PARTS, INC. AND SUBSIDIARIES
NOTES TO THE CONSOLIDATED FINANCIAL STATEMENTS
January 2, 2010, January 3, 2009 and December 29, 2007
(in thousands, except per share data)
.
F-42
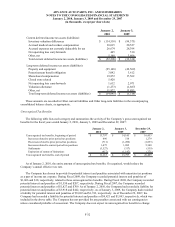
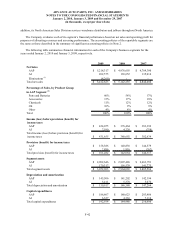
addition, its North American Sales Division services warehouse distributors and jobbers throughout North America.
The Company evaluates each of its segment’s financial performance-based on net sales and operating profit for
purposes of allocating resources and assessing performance. The accounting policies of the reportable segments are
the same as those described in the summary of significant accounting policies in Note 2.
The following table summarizes financial information for each of the Company's business segments for the
years ended January 2, 2010 and January 3, 2009, respectively.
2009 2008 2007
Net Sales
AAP 5,218,317$ 4,976,603$ 4,709,390$
AI 202,575 165,652 135,014
Eliminations (1) (8,269) - -
Total net sales 5,412,623$ 5,142,255$ 4,844,404$
Percentage of Sales, by Product Group
in AAP Segment (2)
Parts and Batteries 60% 58% 57%
Accessories 15% 17% 18%
Chemicals 11% 12% 12%
Oil 10% 9% 9%
Other 4%4%4%
Total 100% 100% 100%
Income (loss) before provision (benefit) for
income taxes
AAP 424,075$ 376,464$ 383,392$
AI 7,580 4,228 (758)
Total income (loss) before provision (benefit) for
income taxes 431,655$ 380,692$ 382,634$
Provision (benefit) for income taxes
AAP 158,386$ 140,838$ 144,579$
AI 2,896 1,816 (262)
Total provision (benefit) for income taxes 161,282$ 142,654$ 144,317$
Segment assets
AAP 2,902,646$ 2,807,486$ 2,663,791$
AI 170,317 156,579 141,775
Total segment assets 3,072,963$ 2,964,065$ 2,805,566$
Depreciation and amortization
AAP 145,506$ 141,202$ 142,194$
AI 5,411 5,378 5,070
Total depreciation and amortizatio
n
150,917$ 146,580$ 147,264$
Capital expenditures
AAP 186,607$ 180,623$ 203,486$
AI 6,327 4,363 7,114
Total capital expenditures 192,934$ 184,986$ 210,600$