AT&T Wireless 2006 Annual Report Download - page 81
Download and view the complete annual report
Please find page 81 of the 2006 AT&T Wireless annual report below. You can navigate through the pages in the report by either clicking on the pages listed below, or by using the keyword search tool below to find specific information within the annual report.-
 1
1 -
2
-
3
-
4
-
5
-
6
-
7
-
8
-
9
-
10
-
11
-
12
-
13
-
14
-
15
-
16
-
17
-
18
-
19
-
20
-
21
-
22
-
23
-
24
-
25
-
26
-
27
-
28
-
29
-
30
-
31
-
32
-
33
-
34
-
35
-
36
-
37
-
38
-
39
-
40
-
41
-
42
-
43
-
44
-
45
-
46
-
47
-
48
-
49
-
50
-
51
-
52
-
53
-
54
-
55
-
56
-
57
-
58
-
59
-
60
-
61
-
62
-
63
-
64
-
65
-
66
-
67
-
68
-
69
-
70
-
 71
71 -
 72
72 -
 73
73 -
 74
74 -
 75
75 -
 76
76 -
 77
77 -
 78
78 -
 79
79 -
 80
80 -
 81
81 -
 82
82 -
 83
83 -
 84
84 -
 85
85 -
 86
86 -
 87
87 -
 88
88
 |
 |

2006 AT&T Annual Report : :
79
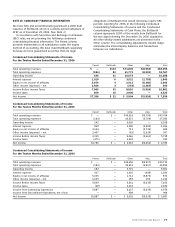
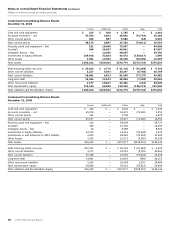
Condensed Consolidating Statements of Cash Flows
Twelve Months Ended December 31, 2006
Parent BellSouth Other Adjs. Total
Net cash from operating activities $ 5,017 $ 22 $ 7,104 $ 3,472 $15,615
Net cash from investing activities (1,435) 386 (7,244) — (8,293)
Net cash from financing activities (3,577) — 921 (3,472) (6,128)
Net Increase in Cash $ 5 $408 $ 781 $ — $ 1,194
Condensed Consolidating Statements of Cash Flows
Twelve Months Ended December 31, 2005
Parent BellSouth Other Adjs. Total
Net cash from operating activities $ 4,969 $ — $10,567 $ (2,562) $ 12,974
Net cash from investing activities 2,849 — (3,823) — (974)
Net cash from financing activities (8,227) — (5,561) 2,562 (11,226)
Net increase (decrease) in cash from continuing operations (409) — 1,183 — 774
Net increase (decrease) in cash from discontinued operations — — (310) — (310)
Net Increase (Decrease) in Cash $ (409) $ — $ 873 $ — $ 464
Condensed Consolidating Statements of Cash Flows
Twelve Months Ended December 31, 2004
Parent BellSouth Other Adjs. Total
Net cash from operating activities $(14,941) $ — $ 1,830 $24,061 $ 10,950
Net cash from investing activities (407) — (20,340) — (20,747)
Net cash from financing activities 11,367 — 17,304 (24,061) 4,610
Net increase (decrease) in cash from continuing operations (3,981) — (1,206) — (5,187)
Net increase in cash from discontinued operations — — 1,141 — 1,141
Net Increase (Decrease) in Cash $ (3,981) $ — $ (65) $ — $ (4,046)
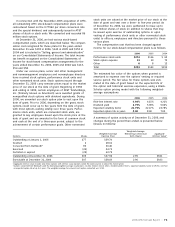
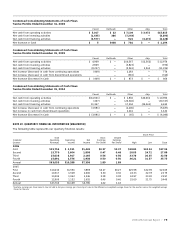
NOTE 19. QUARTERLY FINANCIAL INFORMATION (UNAUDITED)
The following table represents our quarterly financial results:
Stock Price
Total Basic Diluted
Calendar Operating Operating Net Earnings Earnings
Quarter Revenues Income Income Per Share1 Per Share1 High Low Close
2006
First $15,756 $ 2,191 $1,445 $0.37 $0.37 $28.82 $24.24 $27.04
Second 15,770 2,604 1,808 0.47 0.46 28.03 24.72 27.89
Third 15,638 2,917 2,165 0.56 0.56 33.76 26.35 32.56
Fourth 15,891 2,576 1,938 0.50 0.50 36.21 31.57 35.75
Annual $63,055 $10,288 $7,356 1.89 1.89
2005
First $10,234 $1,556 $885 $0.27 $0.27 $25.98 $22.99 $23.69
Second 10,317 1,518 1,000 0.30 0.30 24.33 22.78 23.75
Third 10,304 1,962 1,246 0.38 0.38 24.97 23.20 23.97
Fourth 12,909 1,132 1,655 0.46 0.46 25.60 21.75 24.49
Annual $43,764 $6,168 $4,786 1.42 1.42
1 Quarterly earnings per share impacts may not add to full-year earnings per share impacts due to the difference in weighted-average shares for the quarters versus the weighted-average
shares for the year.