AT&T Wireless 2006 Annual Report Download - page 30
Download and view the complete annual report
Please find page 30 of the 2006 AT&T Wireless annual report below. You can navigate through the pages in the report by either clicking on the pages listed below, or by using the keyword search tool below to find specific information within the annual report.
28 : :
2006 AT&T Annual Report
Management’s Discussion and Analysis of Financial Condition and Results of Operations (continued)
Dollars in millions except per share amounts
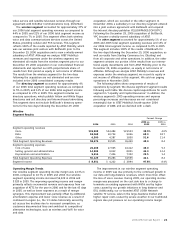
Directory
Segment Results
Percent Change
2006 vs. 2005 vs.
2006 2005 2004 2005 2004
Total Segment Operating Revenues $3,702 $3,714 $3,759 (0.3)% (1.2)%
Segment operating expenses
Cost of sales 1,117 1,104 1,022 1.2 8.0
Selling, general and administrative 643 611 622 5.2 (1.8)
Depreciation and amortization 3 5 9 (40.0) (44.4)
Total Segment Operating Expenses 1,763 1,720 1,653 2.5 4.1
Segment Operating Income 1,939 1,994 2,106 (2.8) (5.3)
Equity in Net Income (Loss) of Affiliates (17) (5) — — —
Segment Income $1,922 $1,989 $2,106 (3.4)% (5.6)%
Pages print advertising, which was partially offset by an
increase of $75 in Internet advertising revenue. Revenues in
2005 decreased primarily due to a decrease of $74 in our
local Yellow Pages print advertising, which was partially offset
by an increase of $39 in Internet advertising revenue. These
results reflect the impact of competition from other publish-
ers, other advertising media and continuing economic pres-
sures on advertising customers.
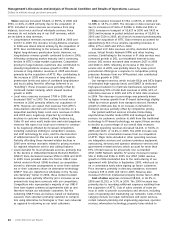
Cost of sales increased $13, or 1.2%, in 2006 and in-
creased $82, or 8.0%, in 2005. The increase in 2006 was
primarily due to higher costs for Internet traffic of $20,
partially offset by a decrease in printing costs of $5. In 2005,
cost of sales increased due to higher costs for Internet traffic
of $22, publishing of $17 and distribution of $9.
Selling, general and administrative expenses increased
$32, or 5.2%, in 2006 and decreased $11, or 1.8%, in 2005.
Increased expenses in 2006 were primarily due to increases in
other directory segment costs, including brand advertising and
employee benefits of $102, partially offset by lower bad debt
expense of $74. The expense reduction in 2005 was primarily
due to lower advertising expense.
In September 2004, we sold our interest in the directory
advertising business in Illinois and northwest Indiana. Our
directory segment results exclude the results of those opera-
tions (see Note 15). In December 2004, our directory segment
entered into a joint venture agreement with BellSouth and
acquired the Internet directory publisher, YPC. Prior to the
December 29, 2006, acquisition of BellSouth (see Note 2), we
accounted for our 66% economic interest in YPC under the
equity method, since we shared control equally with Bell-
South, our 34% economic partner. We had equal voting rights
and representation on the board of directors that controlled
YPC. Following the BellSouth acquisition, YPC became a
wholly-owned subsidiary of AT&T and results will be reflected
in operating revenues and expenses on our Consolidated
Statements of Income.
Our directory segment operating income margin was 52.4%
in 2006, 53.7% in 2005 and 56.0% in 2004. The segment
operating income margin decrease in 2006 and 2005 was a
result of both higher expenses and lower revenues.
Operating revenues decreased $12, or 0.3%, in 2006 and
decreased $45, or 1.2%, in 2005. The decrease in revenues in
2006 was primarily due to a decrease of $93 in our Yellow
Other
Segment Results
Percent Change
2006 vs. 2005 vs.
2006 2005 2004 2005 2004
Total Segment Operating Revenues $ 954 $745 $706 28.1% 5.5%
Total Segment Operating Expenses 977 792 803 23.4 (1.4)
Segment Operating Income (Loss) (23) (47) (97) 51.1 51.5
Equity in Net Income of Affiliates 2,060 614 873 — (29.7)
Segment Income $2,037 $567 $776 — (26.9)%
Our other segment operating results consist primarily of
Sterling, corporate, other operations and, with the closing
of the BellSouth merger on December 29, 2006, BellSouth’s
operating results for the two days after the merger close.
Sterling provides business-integration software and services.
Operating revenues increased $209, or 28.1%, in 2006
and $39, or 5.5%, in 2005. The increase in 2006 is primarily
due to operating revenue from BellSouth, increased intercom-
pany revenue from our captive insurance company (shown as
intersegment revenue in Note 4) and improved operating
revenue at Sterling, partially offset by a decrease in revenue
as a result of the sale of our paging subsidiary in November
2005. Revenue increased in 2005 primarily due to improved
operating revenue at Sterling.
Operating expenses increased $185, or 23.4%, in 2006
and decreased $11, or 1.4%, in 2005. The increase in 2006 is
primarily due to the addition of BellSouth expenses, increased
operating expenses at Sterling and at our captive insurance
company, partially offset by management fees paid in 2005
that did not recur in 2006.


