AT&T Wireless 2006 Annual Report Download - page 24
Download and view the complete annual report
Please find page 24 of the 2006 AT&T Wireless annual report below. You can navigate through the pages in the report by either clicking on the pages listed below, or by using the keyword search tool below to find specific information within the annual report.-
 1
1 -
2
-
3
-
4
-
5
-
6
-
7
-
8
-
9
-
10
-
11
-
12
-
13
-
 14
14 -
 15
15 -
 16
16 -
 17
17 -
 18
18 -
 19
19 -
 20
20 -
 21
21 -
 22
22 -
 23
23 -
 24
24 -
 25
25 -
 26
26 -
 27
27 -
 28
28 -
 29
29 -
 30
30 -
 31
31 -
 32
32 -
 33
33 -
 34
34 -
35
-
36
-
37
-
38
-
39
-
40
-
41
-
42
-
43
-
44
-
45
-
46
-
47
-
48
-
49
-
50
-
51
-
52
-
53
-
54
-
55
-
56
-
57
-
58
-
59
-
60
-
61
-
62
-
63
-
64
-
65
-
66
-
67
-
68
-
69
-
70
-
71
-
72
-
73
-
74
-
75
-
76
-
77
-
78
-
79
-
80
-
81
-
82
-
83
-
84
-
85
-
86
-
87
-
88
 |
 |

22 : :
2006 AT&T Annual Report
Management’s Discussion and Analysis of Financial Condition and Results of Operations (continued)
Dollars in millions except per share amounts
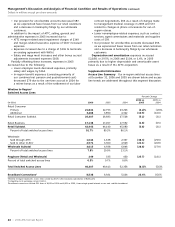
Voice revenues increased $9,424, or 38.5%, in 2006 and
$931, or 4.0%, in 2005 primarily due to the acquisition of
ATTC. Included in voice revenues are revenues from long
distance, local voice and local wholesale services. Voice
revenues do not include any of our VoIP revenues, which
are included in data revenues.
• Long-distance revenues increased $9,268 in 2006 and
$1,673 in 2005. The increase in long-distance revenues
in 2006 was driven almost entirely by the acquisition of
ATTC. Also contributing to the increase in 2006 were
higher long-distance penetration levels. However, our
long-distance revenue growth continued to slow in 2006,
reflecting continuing market maturity and a continuing
decline in ATTC’s mass-market customers. Competitive
pricing for large-business customers also contributed to
slowing long-distance revenue growth in 2006. The
increase in long-distance revenues in 2005 was driven
primarily by the acquisition of ATTC. Also contributing to
the increase in 2005 were increases in long-distance
penetration levels and sales of combined long-distance
and local calling fixed-fee offerings (referred to as
“bundling”). These increases were partially offset by
continued market maturity, which slowed revenue
growth in 2005.
• Local voice revenues increased $708 in 2006 and
decreased $607 in 2005. The increase in local voice
revenues in 2006 primarily reflects our acquisition of
ATTC. However, we expect that revenues from ATTC’s
mass-market customers will continue to decline on a
sequential quarterly basis. Local voice revenues in 2006
and 2005 were negatively impacted by continued
declines in customer demand, calling features (e.g.,
Caller ID and voice mail), inside wire and retail payphone
revenues. We expect our local voice revenue to continue
to be negatively affected by increased competition,
including customers shifting to competitors’ wireless
and VoIP technology for voice, and the disconnection
of additional lines for DSL service and other reasons.
Partially offsetting these demand-related declines in
2006 were revenue increases related to pricing increases
for regional telephone service and calling features.
• Lower demand for local wholesale services, primarily due
to the decline in Unbundled Network Element-Platform
(UNE-P) lines, decreased revenue $552 in 2006 and $135
in 2005. Lines provided under the former UNE-P rules
(which ended in March 2006) declined, as competitors
moved to alternate arrangements to serve their custom-
ers or their customers chose an alternative technology.
(UNE-P lines are classified as wholesale in the “Access
Line Summary” table.) In 2006, these demand-related
decreases were partially offset by price increases as we
entered into long-term contracts with our competitors.
Competitors who represented a majority of our UNE-P
lines have signed commercial agreements with us and
therefore remain our wholesale customers. For the
remaining UNE-P lines, we believe, based on marketing
research, that customers primarily switched to competi-
tors using alternative technologies or their own networks
as opposed to returning as our retail customers.
Data revenues increased $7,334, or 68.3%, in 2006 and
$1,688, or 18.7%, in 2005. The increase in data revenues was
due to increases in IP data of $2,846 in 2006 and $931 in
2005, increases in transport of $2,427 in 2006 and $433 in
2005 and increases in packet switched services of $2,061 in
2006 and $324 in 2005, all of which increased predominantly
due to the acquisition of ATTC. Data revenues accounted for
approximately 31% of our wireline operating revenues in
2006, 27% in 2005 and 25% in 2004.
Included in IP data revenues are DSL, dedicated Internet
access, Virtual Private Network (VPN) and other hosting
services. Contributing to the increase in IP data services was
continued growth in DSL, our broadband Internet-access
service. DSL service increased data revenues $427 in 2006
and $444 in 2005, reflecting an increase in DSL lines in
service and, in 2005, was partially driven by lower-priced
promotional offerings as a response to competitive pricing
pressures. Revenue from our VPN product also contributed
to IP data growth in 2006.
Our transport services, which include DS1s and DS3s (types
of dedicated high-capacity lines), and SONET (a dedicated
high-speed solution for multi-site businesses), represented
approximately 50% of total data revenues in 2006, 61% of
total data revenues in 2005 and 67% of total data revenues
in 2004. This decrease in percentage was primarily driven
by higher revenue growth from IP-based technology, slightly
offset by revenue growth from transport services. Revenue
growth in 2006 was due to an increase in demand for
transport services partially offset by competitive pricing.
Our packet switched services includes Frame Relay,
asynchronous transfer mode (ATM) and managed packet
services. As customers continue to shift from this traditional
technology to IP-based technology, we expect these services
to decline as a percentage of our overall data revenues.
Other operating revenues increased $2,213, or 51.6%, in
2006 and $437, or 11.4%, in 2005. The 2006 increase was
primarily due to incremental revenue from our acquisition
of ATTC. Major items included in other operating revenues
are integration services and customer premises equipment,
outsourcing, directory and operator assistance services and
government-related services, which account for more than
67% of total revenue for all periods. Our co-branded
AT&T | DISH Network satellite TV service increased revenue
$36 in 2006 and $196 in 2005. Our AT&T | DISH revenue
growth in 2006 moderated due to the restructuring of our
agreement with EchoStar in September 2005, which put us
on a commission basis when signing up future customers.
Price increases, primarily in directory assistance, increased
revenues $35 in 2006 and $23 in 2005. Revenue also
increased $70 from intellectual property license fees in 2006.
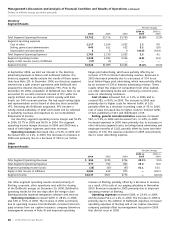
Cost of sales expenses increased $8,261, or 46.0%, in
2006 and $1,533, or 9.3%, in 2005. The 2006 increase was
primarily due to recording additional expenses resulting from
the acquisition of ATTC. Cost of sales consists of costs we
incur in order to provide our products and services, including
costs of operating and maintaining our networks. Costs in this
category include our repair technicians and repair services,
certain network planning and engineering expenses, operator
services, information technology, property taxes related to