AT&T Wireless 2006 Annual Report Download - page 23
Download and view the complete annual report
Please find page 23 of the 2006 AT&T Wireless annual report below. You can navigate through the pages in the report by either clicking on the pages listed below, or by using the keyword search tool below to find specific information within the annual report.-
 1
1 -
2
-
3
-
4
-
5
-
6
-
7
-
8
-
9
-
10
-
11
-
12
-
 13
13 -
 14
14 -
 15
15 -
 16
16 -
 17
17 -
 18
18 -
 19
19 -
 20
20 -
 21
21 -
 22
22 -
 23
23 -
 24
24 -
 25
25 -
 26
26 -
 27
27 -
 28
28 -
 29
29 -
 30
30 -
 31
31 -
 32
32 -
 33
33 -
34
-
35
-
36
-
37
-
38
-
39
-
40
-
41
-
42
-
43
-
44
-
45
-
46
-
47
-
48
-
49
-
50
-
51
-
52
-
53
-
54
-
55
-
56
-
57
-
58
-
59
-
60
-
61
-
62
-
63
-
64
-
65
-
66
-
67
-
68
-
69
-
70
-
71
-
72
-
73
-
74
-
75
-
76
-
77
-
78
-
79
-
80
-
81
-
82
-
83
-
84
-
85
-
86
-
87
-
88
 |
 |

2006 AT&T Annual Report : :
21
video service and satellite television services through our
agreement with EchoStar Communications Corp. (EchoStar).
The wireless segment accounted for approximately 37% of
our 2006 total segment operating revenues as compared to
44% in 2005; and 21% of our 2006 total segment income as
compared to 7% in 2005. This segment offers both wireless
voice and data communications services across the United
States, providing cellular and PCS services. This segment
reflects 100% of the results reported by AT&T Mobility, which
was our wireless joint venture with BellSouth prior to the
December 29, 2006 acquisition and is now a wholly-owned
subsidiary of AT&T. Although we analyze AT&T Mobility’s
revenues and expenses under the wireless segment, we
eliminated all results from the wireless segment prior to our
December 29, 2006 acquisition in our consolidated financial
statements and reported our 60% proportionate share of
results from that period as equity in net income of affiliates.
The results from the wireless segment for the two days
following the acquisition are not eliminated and are now
included in the 2006 consolidated company results.
The directory segment accounted for approximately 4%
of our 2006 total segment operating revenues as compared
to 5% in 2005; and 12% of our 2006 total segment income
as compared to 27% in 2005. This segment includes our
directory operations, which publish Yellow and White Pages
directories and sell directory and Internet-based advertising.
This segment does not include BellSouth’s directory opera-
tions for the two days following the December 29, 2006
acquisition, which are recorded in the other segment. In
November 2004, a subsidiary in our directory segment entered
into a joint venture agreement with BellSouth and acquired
the Internet directory publisher YELLOWPAGES.COM (YPC).
Following the December 29, 2006 acquisition of BellSouth,
YPC became a wholly-owned subsidiary of AT&T.
The other segment accounted for approximately 1% of our
2006 and 2005 total segment operating revenues and 13% of
our 2006 total segment income, as compared to 8% in 2005.
This segment includes 100% of the results of BellSouth for
the two days following the December 29, 2006 acquisition, as
well as results from Sterling Commerce Inc. (Sterling) and
from all corporate and other operations. In addition, the other
segment contains our portion of the results from our interna-
tional equity investments and from AT&T Mobility, prior to the
December 29, 2006 acquisition, as equity in net income of
affiliates. Although we analyze AT&T Mobility’s revenues and
expenses under the wireless segment, we record its equity in
net income of affiliates in this segment. We sold our paging
operations in November 2005.
The following tables show components of results of
operations by segment. We discuss significant segment results
following each table. We discuss capital expenditures for each
segment in “Liquidity and Capital Resources.” In addition, the
wireless segment’s 2005 operating revenue and expense
percentage increases and decreases are not considered
meaningful due to AT&T Mobility’s fourth-quarter 2004
acquisition of AWE, and are denoted with a dash.
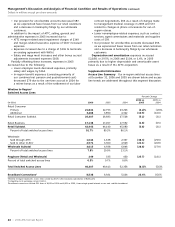
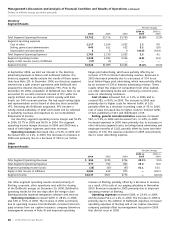
Wireline
Segment Results
Percent Change
2006 vs. 2005 vs.
2006 2005 2004 2005 2004
Segment operating revenues
Voice $33,908 $24,484 $23,553 38.5% 4.0%
Data 18,068 10,734 9,046 68.3 18.7
Other 6,500 4,287 3,850 51.6 11.4
Total Segment Operating Revenues 58,476 39,505 36,449 48.0 8.4
Segment operating expenses
Cost of sales 26,206 17,945 16,412 46.0 9.3
Selling, general and administrative 14,305 9,912 8,821 44.3 12.4
Depreciation and amortization 9,614 7,426 7,322 29.5 1.4
Total Segment Operating Expenses 50,125 35,283 32,555 42.1 8.4
Segment Income $ 8,351 $ 4,222 $ 3,894 97.8% 8.4%
Operating Margin Trends
Our wireline segment operating income margin was 14.3% in
2006, compared to 10.7% in 2005 and 2004. Our wireline
segment operating income increased $4,129 in 2006 and
$328 in 2005. The improving operating income and margin
primarily reflects incremental revenue and expenses from our
acquisition of ATTC for the year in 2006 and for the last 43 days
in 2005, as well as lower expenses as a result of merger
synergies. This improvement was partially offset by additional
amortization expense and lower voice revenue as a result of
continued in-region (i.e., the 13 states historically served by
us) access line declines due to increased competition, as
customers disconnected lines and switched to competitors’
alternative technologies, such as wireless and VoIP, for voice
and data.
The improvement in our wireline segment operating
income in 2005 was due primarily to the continued growth in
our data and long-distance revenues, which more than offset
the loss of voice revenue. During 2005, our operating income
margin was pressured on the cost side due to a charge to
terminate an existing agreement with WilTel and by higher
costs caused by our growth initiatives in long distance and
DSL. Additionally, our co-branded AT&T | DISH Network
satellite TV service, sales in the large-business market and
higher repair costs caused by severe weather in our traditional
regions also put pressure on our operating income margin.