AT&T Wireless 2006 Annual Report Download - page 22
Download and view the complete annual report
Please find page 22 of the 2006 AT&T Wireless annual report below. You can navigate through the pages in the report by either clicking on the pages listed below, or by using the keyword search tool below to find specific information within the annual report.-
 1
1 -
2
-
3
-
4
-
5
-
6
-
7
-
8
-
9
-
10
-
11
-
 12
12 -
 13
13 -
 14
14 -
 15
15 -
 16
16 -
 17
17 -
 18
18 -
 19
19 -
 20
20 -
 21
21 -
 22
22 -
 23
23 -
 24
24 -
 25
25 -
 26
26 -
 27
27 -
 28
28 -
 29
29 -
 30
30 -
 31
31 -
 32
32 -
33
-
34
-
35
-
36
-
37
-
38
-
39
-
40
-
41
-
42
-
43
-
44
-
45
-
46
-
47
-
48
-
49
-
50
-
51
-
52
-
53
-
54
-
55
-
56
-
57
-
58
-
59
-
60
-
61
-
62
-
63
-
64
-
65
-
66
-
67
-
68
-
69
-
70
-
71
-
72
-
73
-
74
-
75
-
76
-
77
-
78
-
79
-
80
-
81
-
82
-
83
-
84
-
85
-
86
-
87
-
88
 |
 |

20 : :
2006 AT&T Annual Report
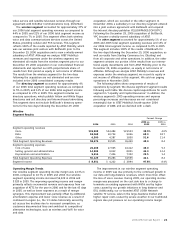
The increase in 2005 operating expense includes a $236
charge to terminate an agreement with WilTel, merger-related
asset impairments of $349 and severance accrual increases of
$283 related to the ATTC acquisition. Partially offsetting these
items were decreases due to expenses incurred in 2004
related to strike preparation and labor-contract settlements
of $263 and to a net decrease of $186 reflecting changes in
postretirement benefits in 2005 and 2004. Our significant
expense changes are discussed in greater detail in our
“Segment Results” sections.
Interest expense increased $387, or 26.6%, in 2006 and
$433, or 42.3%, in 2005. The increase in 2006 was primarily
due to recording a full year of interest expense on ATTC’s
outstanding debt.
The increase in 2005 was primarily due to issuing additional
debt in the fourth quarter of 2004, thus accruing interest
expense for a full 12 months of 2005 in comparison to less
than three months of 2004. In 2004 we issued debt totaling
approximately $8,750 to finance our portion of AT&T Mobility’s
purchase price for AT&T Wireless Services, Inc. (AWE).
Interest income decreased $6, or 1.6%, in 2006 and $109,
or 22.2%, in 2005. The decrease in 2006 was primarily due to
the lower average balance in 2006 on our shareholder loan
to AT&T Mobility, which was partially offset by increased interest
income on advances to AT&T Mobility under the terms of
our revolving credit agreement (see Note 14). Prior to the
December 29, 2006 acquisition of BellSouth, AT&T Mobility
borrowed funds from us under a shareholder loan and
revolving credit agreement. Following the BellSouth acquisi-
tion, AT&T Mobility became a wholly-owned subsidiary and our
consolidated financial statements will no longer include
interest income or interest expense paid from subsidiaries.
The decrease in 2005 was primarily due to lower investment
balances during 2005 as investments held for the majority of
2004 were liquidated and used to fund our portion of AT&T
Mobility’s purchase price for AWE, and less income earned on
our advances to AT&T Mobility resulting from payments during
2005 on a portion of outstanding advances due to us.
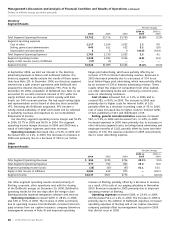
Equity in net income of affiliates increased $1,434 in
2006 and decreased $264, or 30.2%, in 2005. The increase in
2006 was primarily due to our proportionate share of AT&T
Mobility’s improved results of $1,308 in 2006. The 2005
decrease was due to lower results from our international
holdings of $345, partially offset by an increase of $170 in
our proportionate share of AT&T Mobility’s results.
Investments in partnerships, joint ventures and less than
majority-owned subsidiaries where we have significant
influence are accounted for under the equity method. Prior to
the December 29, 2006 BellSouth acquisition (see Note 2), we
accounted for our 60% economic interest in AT&T Mobility
under the equity method since we had been sharing control
equally with BellSouth. We had equal voting rights and
representation on the Board of Directors that controlled
AT&T Mobility. (After the BellSouth acquisition, AT&T Mobility
became a wholly-owned subsidiary of AT&T and wireless
results will be reflected in operating revenues and expenses
on our Consolidated Statements of Income.)
Other income (expense) – net We had other income of
$16 in 2006, $14 in 2005 and $922 in 2004. There were no
individually significant other income or expense transactions
during 2006.
Results for 2005 primarily included a gain of $108 on the
sales of shares of Amdocs Limited (Amdocs), American Tower
Corp. (American Tower) and Yahoo! Inc. (Yahoo) and other
miscellaneous gains. These gains were partially offset by
other expenses of $126 to reflect an increase in value of a
third-party minority holder’s interest in an AT&T subsidiary’s
preferred stock and other miscellaneous expenses.
Results for 2004 primarily included a gain of $832 on the
sale of our investment in Belgacom S.A., gains of $270 on the
sales of shares of Amdocs and Yahoo, and a gain of $57 on
the sales of shares of Teléfonos de México, S.A. de C.V.
(Telmex) and América Móvil S.A. de C.V. (América Móvil).
Included in items that partially offset those gains were losses
of $138 on the sale of all of our shares of TDC and $82 on
the sale of all of our shares of Telkom S.A. Limited.
Income taxes increased $2,593 in 2006 and decreased
$1,254, or 57.4%, in 2005. Our effective tax rate in 2006 was
32.4%, compared to 16.3% in 2005 and 30.5% in 2004. The
increase in income tax expense in 2006 compared to 2005
was primarily due to the higher income before income taxes in
2006 and our agreement in December 2005 with the Internal
Revenue Service (IRS) to settle certain claims principally
related to the utilization of capital losses and tax credits
for tax years 1997-1999. The settlement resulted in our
recognition of $902 of reduced income tax expense in 2005.
The decrease in income taxes and our effective tax rate in
2005 compared to 2004 was due primarily to our agreement
with the IRS, discussed above. (See Note 9)
Income from discontinued operations was $908 in 2004
and represents results from the directory advertising business
in Illinois and northwest Indiana that we sold in 2004.
(See Note 15)
Segment Results
Our segments represent strategic business units that offer
different products and services and are managed accordingly.
As a result of our November 18, 2005 acquisition of ATTC we
revised our segment reporting to represent how we now
manage our business, restating prior periods to conform to
the current segments. Due to the proximity of our December
29, 2006 acquisition of BellSouth to year-end, we have
reported the two days of results from BellSouth in the other
segment. Our operating segment results presented in Note 4
and discussed below for each segment follow our internal
management reporting. We analyze our various operating
segments based on segment income before income taxes (see
Note 4). Each segment’s percentage of total segment operat-
ing revenue calculation is derived from our segment results
table in Note 4 and reflects amounts before eliminations.
Operating income percentage fluctuations were largely due to
improved results in our wireless segment as well as the
inclusion of ATTC in our wireline segment for all of 2006, as
opposed to only 43 days in 2005. We have four reportable
segments: (1) wireline, (2) wireless, (3) directory and (4) other.
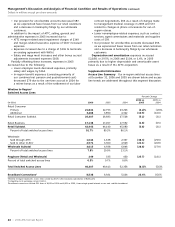
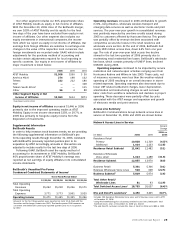
The wireline segment accounted for approximately 58% of
our 2006 total segment operating revenues as compared to
50% in 2005; and 54% of our 2006 total segment income as
compared to 58% in 2005. This segment provides both retail
and wholesale landline telecommunications services, including
local and long-distance voice, switched access, Internet
Protocol (IP) and Internet access data, messaging services,
managed networking to business customers, our U-verseSM
Management’s Discussion and Analysis of Financial Condition and Results of Operations (continued)
Dollars in millions except per share amounts