AT&T Wireless 2006 Annual Report Download - page 45
Download and view the complete annual report
Please find page 45 of the 2006 AT&T Wireless annual report below. You can navigate through the pages in the report by either clicking on the pages listed below, or by using the keyword search tool below to find specific information within the annual report.-
 1
1 -
2
-
3
-
4
-
5
-
6
-
7
-
8
-
9
-
10
-
11
-
12
-
13
-
14
-
15
-
16
-
17
-
18
-
19
-
20
-
21
-
22
-
23
-
24
-
25
-
26
-
27
-
28
-
29
-
30
-
31
-
32
-
33
-
34
-
 35
35 -
 36
36 -
 37
37 -
 38
38 -
 39
39 -
 40
40 -
 41
41 -
 42
42 -
 43
43 -
 44
44 -
 45
45 -
 46
46 -
 47
47 -
 48
48 -
 49
49 -
 50
50 -
 51
51 -
 52
52 -
 53
53 -
 54
54 -
 55
55 -
56
-
57
-
58
-
59
-
60
-
61
-
62
-
63
-
64
-
65
-
66
-
67
-
68
-
69
-
70
-
71
-
72
-
73
-
74
-
75
-
76
-
77
-
78
-
79
-
80
-
81
-
82
-
83
-
84
-
85
-
86
-
87
-
88
 |
 |

2006 AT&T Annual Report : :
43
Total Number of
Shares Purchased as Maximum Number of
Part of Publicly Shares that May Yet
Total Number of Average Price Announced Plans Be Purchased Under
Purchase Period Shares Purchased Paid per Share1 or Programs the Plans or Programs
October 2, 2006 – October 31, 2006 12,600,000 $33.05 12,600,000 342,430,000
November 1, 2006 – November 30, 2006 13,832,816 $33.28 13,832,816 328,597,184
December 1, 2006 – December 20, 2006 12,765,068 $34.64 12,765,068 315,832,116
Total 39,197,884 $33.65 39,197,884 315,832,116
1Average Price Paid per Share excludes transaction costs.
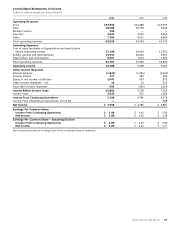
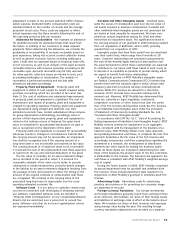
The comparison above assumes $100 invested on December
31, 2001, in AT&T common stock, Standard & Poor’s 500 Index
(S&P 500), Standard & Poor’s 500 Integrated Telecom Index
(Telecom Index) and a Peer Group of other large U.S. telecommu-
nications companies (BellSouth and Verizon). The index of
telecommunications companies (Peer Group) is weighted
according to the market capitalization of its component
companies at the beginning of each period. As a result of the
acquisition of BellSouth on December 29, 2006, the Peer Group
will no longer represent multiple independent companies, so
we have adopted the Telecom Index to represent comparable
companies. Total return equals stock price appreciation plus
reinvestment of dividends on a quarterly basis.
CERTIFICATI O N BY T H E CHIEF E X ECUTIVE O F F I C E R
As required under the rules of the New York Stock Exchange
(NYSE), our chief executive officer has timely submitted to
the NYSE his annual certification that he is not aware of any
violation by the company of NYSE corporate governance
standards. Also as required under the rules of the NYSE,
readers are advised that the certifications required under
Section 302 of the Sarbanes-Oxley Act of 2002 are not
included in this report but instead are included as exhibits
to our Annual Report on Form 10-K for 2006.
RISK FACTORS
In addition to the other information set forth in this document,
including the matters contained under the caption “Cautionary
Language Concerning Forward-Looking Statements,” you
should carefully read the matters described below. We believe
that each of these matters could materially affect our
business. We recognize that most of these factors are beyond
our ability to control and therefore to predict an outcome.
Accordingly, we have organized them by first addressing
general factors, then industry factors and, finally, items
specifically applicable to us.
140
130
120
110
100
90
80
70
60
72
70
78
79
69
73 76
79
91
111 117
135
100
75
76
77
117
116
113
12/01 12/02 12/03 12/04 12/05 12/06
80
S&P 500 Integrated
Telecom Index
AT&T Inc. Peer Group S&P 500 Index
STO C K PERFO R M A N C E GRAPH
Comparison of Five Year Cumulative Total Return
AT&T Inc., S&P 500 Index, Peer Group, and S&P 500 Integrated Telecom Index
Issuer Equity Repurchases
On March 4, 2006, our Board of Directors authorized the
repurchase of up to 400 million shares of AT&T common
stock; this authorization expires at the end of 2008. During
the fourth quarter of 2006, we repurchased 39.2 million
shares at a cost of $1,319. Under this repurchase plan, we
repurchased $2,678 in shares during 2006. We expect our
combined buyback for 2006 and 2007 to total $10,000 at
the end of 2007. We have repurchased, and intend to
continue to repurchase, shares pursuant to plans that comply
with the requirements of Rule 10b5-1(c) under the Securities
Exchange Act of 1934. We will fund our share repurchases
through a combination of cash from operations, borrowings,
dependent upon market conditions, and cash from the
disposition of certain non-strategic investments.