AT&T Wireless 2006 Annual Report Download - page 76
Download and view the complete annual report
Please find page 76 of the 2006 AT&T Wireless annual report below. You can navigate through the pages in the report by either clicking on the pages listed below, or by using the keyword search tool below to find specific information within the annual report.-
 1
1 -
2
-
3
-
4
-
5
-
6
-
7
-
8
-
9
-
10
-
11
-
12
-
13
-
14
-
15
-
16
-
17
-
18
-
19
-
20
-
21
-
22
-
23
-
24
-
25
-
26
-
27
-
28
-
29
-
30
-
31
-
32
-
33
-
34
-
35
-
36
-
37
-
38
-
39
-
40
-
41
-
42
-
43
-
44
-
45
-
46
-
47
-
48
-
49
-
50
-
51
-
52
-
53
-
54
-
55
-
56
-
57
-
58
-
59
-
60
-
61
-
62
-
63
-
64
-
65
-
 66
66 -
 67
67 -
 68
68 -
 69
69 -
 70
70 -
 71
71 -
 72
72 -
 73
73 -
 74
74 -
 75
75 -
 76
76 -
 77
77 -
 78
78 -
 79
79 -
 80
80 -
 81
81 -
 82
82 -
 83
83 -
 84
84 -
 85
85 -
 86
86 -
87
-
88
 |
 |

74 : :
2006 AT&T Annual Report
Notes to Consolidated Financial Statements (continued)
Dollars in millions except per share amounts
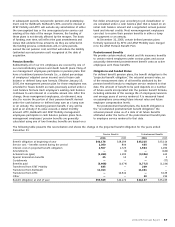
The weighted-average fair value of each option granted during
the year ended December 31 was $4.78 in 2006, $3.39 in
2005 and $4.06 in 2004. The total intrinsic value of options
exercised during the year was $134 in 2006, $24 in 2005 and
$33 in 2004.
A summary of the status of our nonvested stock units,
which includes performance stock units as of December 31,
2006, and changes during the period then ended is presented
below (shares in millions):
Weighted-
Average
Grant-Date
Nonvested Stock Units Shares Fair Value
Nonvested at January 1, 2006 15 $24.91
Granted 15 25.45
Converted from BellSouth 6 21.54
Vested (10) 25.95
Forfeited (1) 25.18
Nonvested at December 31, 2006 25 $24.03
As of December 31, 2006, there was $230 of total unrecog-
nized compensation cost related to nonvested stock-based
compensation arrangements granted. That cost is expected to
be recognized over a weighted-average period of 1.75 years.
The total fair value of shares vested during the years ended
December 31, 2006, 2005 and 2004 was $246, $38 and $24.
Cash received from option exercises under all stock-based
payment arrangements for the years ended December 31 was
$614 in 2006, $192 in 2005 and $234 in 2004. The actual tax
benefit realized for the tax deductions from option exercises
from these arrangements for the years ended December 31,
2006, 2005 and 2004 totaled $28, $9 and $12.
It is our policy to satisfy share option exercises using our
treasury shares.
NOTE 12. STOCKHOLDERS’ EQUITY
From time to time, we repurchase shares of common stock
for distribution through our employee benefit plans or in
connection with certain acquisitions. In March 2006, the Board
of Directors authorized the repurchase of up to 400 million
shares of our common stock. This authorization replaced
previous authorizations and will expire on December 31, 2008.
As of December 31, 2006, we had repurchased approximately
84 million shares under the program.
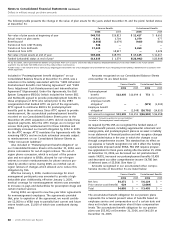
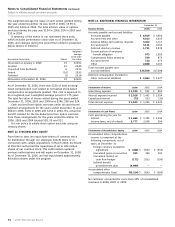
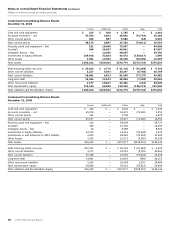
NOTE 13. ADDITIONAL FINANCIAL INFORMATION
December 31,
Balance Sheets 2006 2005
Accounts payable and accrued liabilities:
Accounts payable $ 6,919 $ 4,466
Accrued rents and other 5,013 1,015
Advance billing and customer deposits 3,402 1,717
Accrued payroll 3,111 2,104
Deferred directory revenue 1,721 1,832
Current portion of employee
benefit obligation 973 1,505
Compensated future absences 759 875
Accrued interest 722 473
Other 2,888 3,101
Total accounts payable and
accrued liabilities $25,508 $17,088
Deferred compensation (included in
Other noncurrent liabilities) $ 2,064 $ 1,127
Statements of Income 2006 2005 2004
Advertising expense $ 1,530 $ 812 $ 862
Interest expense incurred $ 1,916 $ 1,492 $ 1,054
Capitalized interest (73) (36) (31)
Total interest expense $ 1,843 $ 1,456 $ 1,023
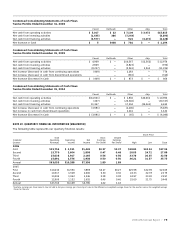
Statements of Cash Flows 2006 2005 2004
Cash paid during the year for:
Interest $ 1,666 $ 1,395 $ 1,043
Income taxes, net of refunds 2,777 2,038 506
Statements of Stockholders’ Equity 2006 2005 2004
Accumulated other comprehensive
income is comprised of the
following components, net of
taxes, at December 31:
Foreign currency translation
adjustment $ (488) $ (505) $ (555)
Unrealized gains on securities 345 340 391
Unrealized (losses) on
cash flow hedges (172) (191) (196)
Defined benefit
postretirement plan (4,999) — —
Accumulated other
comprehensive (loss) $(5,314) $ (356) $ (360)
No customer accounted for more than 10% of consolidated
revenues in 2006, 2005 or 2004.