AT&T Wireless 2006 Annual Report Download - page 72
Download and view the complete annual report
Please find page 72 of the 2006 AT&T Wireless annual report below. You can navigate through the pages in the report by either clicking on the pages listed below, or by using the keyword search tool below to find specific information within the annual report.-
 1
1 -
2
-
3
-
4
-
5
-
6
-
7
-
8
-
9
-
10
-
11
-
12
-
13
-
14
-
15
-
16
-
17
-
18
-
19
-
20
-
21
-
22
-
23
-
24
-
25
-
26
-
27
-
28
-
29
-
30
-
31
-
32
-
33
-
34
-
35
-
36
-
37
-
38
-
39
-
40
-
41
-
42
-
43
-
44
-
45
-
46
-
47
-
48
-
49
-
50
-
51
-
52
-
53
-
54
-
55
-
56
-
57
-
58
-
59
-
60
-
61
-
 62
62 -
 63
63 -
 64
64 -
 65
65 -
 66
66 -
 67
67 -
 68
68 -
 69
69 -
 70
70 -
 71
71 -
 72
72 -
 73
73 -
 74
74 -
 75
75 -
 76
76 -
 77
77 -
 78
78 -
 79
79 -
 80
80 -
 81
81 -
 82
82 -
83
-
84
-
85
-
86
-
87
-
88
 |
 |

70 : :
2006 AT&T Annual Report
Notes to Consolidated Financial Statements (continued)
Dollars in millions except per share amounts
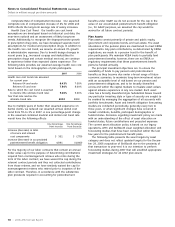
benefits under GAAP, we do not account for the cap in the
value of our accumulated postretirement benefit obligation
(i.e., for GAAP purposes, we assumed the cap would be
waived for all future contract periods).
Plan Assets
Plan assets consist primarily of private and public equity,
government and corporate bonds, and real estate. The asset
allocations of the pension plans are maintained to meet ERISA
requirements. Any plan contributions, as determined by ERISA
regulations, are made to a pension trust for the benefit of
plan participants. We maintain VEBA trusts to partially fund
postretirement benefits; however, there are no ERISA or
regulatory requirements that these postretirement benefit
plans be funded annually.
The principal investment objectives are: to ensure the
availability of funds to pay pension and postretirement
benefits as they become due under a broad range of future
economic scenarios; to maximize long-term investment return
with an acceptable level of risk based on our pension and
postretirement obligations; and to be broadly diversified
across and within the capital markets to insulate asset values
against adverse experience in any one market. Each asset
class has a broadly diversified style. Substantial biases toward
any particular investing style or type of security are sought to
be avoided by managing the aggregation of all accounts with
portfolio benchmarks. Asset and benefit obligation forecasting
studies are conducted periodically, generally every two to
three years, or when significant changes have occurred in
market conditions, benefits, participant demographics or
funded status. Decisions regarding investment policy are made
with an understanding of the effect of asset allocation on
funded status, future contributions and projected expenses.
The current asset allocation policy is based on our legacy
operations, ATTC and BellSouth asset weighted allocation and
forecasting studies that have been conducted within the last
few years for the postretirement benefit plans.
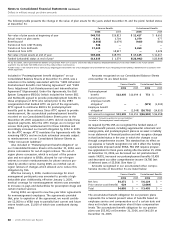
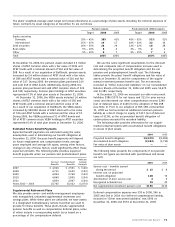
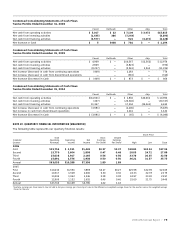
The following table presents the asset targets by asset
category and does not reflect updated targets for the Decem-
ber 29, 2006 acquisition of BellSouth due to the proximity of
that transaction to year-end. It is our intention to perform
forecasting studies during 2007 that will establish appropriate
investment strategies for all AT&T plan assets.
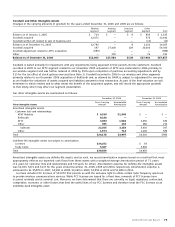
Composite Rate of Compensation Increase Our expected
composite rate of compensation increase of 4% for 2006 and
2005 reflects the long-term average rate of salary increases.
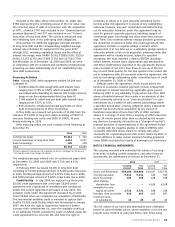
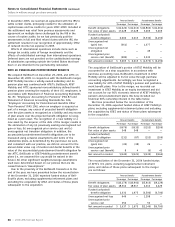
Health Care Cost Trend Our health care cost trend
assumptions are developed based on historical cost data, the
near-term outlook and an assessment of likely long-term
trends. Additionally, to recognize the disproportionate growth
in prescription drug costs, we have developed separate trend
assumptions for medical and prescription drugs. In addition to
the health care cost trend, we assume an annual 3% growth
in administrative expenses. Due to benefit design changes in
recent years (e.g., increased co-pays and deductibles for
prescription drugs and certain medical services), we continue
to experience better than expected claims experience. The
following table provides our assumed average health care cost
trend based on the demographics of plan participants.
2007 2006
Health care cost trend rate assumed
for current year
Retirees 64 and under 6.43% 7.00%
Retirees 65 and over 7.50% 8.00%
Rate to which the cost trend is assumed
to decline (the ultimate trend rate) 5.00% 5.00%
Year that rate reaches the
ultimate trend rate 2010 2009
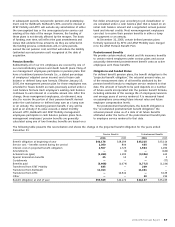
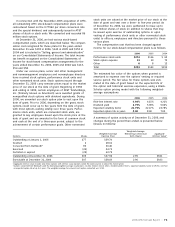
Due to multiple years of better than assumed experience on
dental claims, we reduced our assumed annual dental cost
trend from 5% to 3% in 2007. A one percentage-point change
in the assumed combined medical and dental cost trend rate
would have the following effects:
One Percentage- One Percentage-
Point Increase Point Decrease
Increase (decrease) in total
of service and interest
cost components $ 351 $ (279)
Increase (decrease) in accumulated
postretirement benefit obligation 4,891 (4,040)
For the majority of our labor contracts that contain an annual
dollar value cap for the purpose of determining contributions
required from nonmanagement retirees who retire during the
term of the labor contract, we have waived the cap during the
relevant contract periods and thus not collected contributions
from those retirees, and we have similarly waived the cap for
nonmanagement retirees who retired prior to inception of the
labor contract. Therefore, in accordance with the substantive
plan provisions required in accounting for postretirement