AT&T Wireless 2006 Annual Report Download - page 27
Download and view the complete annual report
Please find page 27 of the 2006 AT&T Wireless annual report below. You can navigate through the pages in the report by either clicking on the pages listed below, or by using the keyword search tool below to find specific information within the annual report.-
 1
1 -
2
-
3
-
4
-
5
-
6
-
7
-
8
-
9
-
10
-
11
-
12
-
13
-
14
-
15
-
16
-
 17
17 -
 18
18 -
 19
19 -
 20
20 -
 21
21 -
 22
22 -
 23
23 -
 24
24 -
 25
25 -
 26
26 -
 27
27 -
 28
28 -
 29
29 -
 30
30 -
 31
31 -
 32
32 -
 33
33 -
 34
34 -
 35
35 -
 36
36 -
 37
37 -
38
-
39
-
40
-
41
-
42
-
43
-
44
-
45
-
46
-
47
-
48
-
49
-
50
-
51
-
52
-
53
-
54
-
55
-
56
-
57
-
58
-
59
-
60
-
61
-
62
-
63
-
64
-
65
-
66
-
67
-
68
-
69
-
70
-
71
-
72
-
73
-
74
-
75
-
76
-
77
-
78
-
79
-
80
-
81
-
82
-
83
-
84
-
85
-
86
-
87
-
88
 |
 |

2006 AT&T Annual Report : :
25
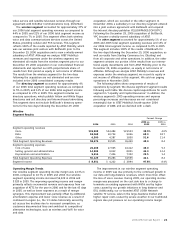
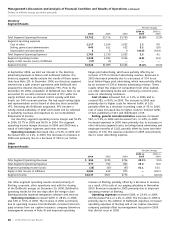
Wireless
Segment Results
Percent Change1
2006 vs. 2005 vs.
2006 2005 2004 2005 2004
Segment operating revenues
Service $33,756 $30,638 $17,602 10.2% —
Equipment 3,750 3,795 1,963 (1.2) —
Total Segment Operating Revenues 37,506 34,433 19,565 8.9 —
Segment operating expenses
Cost of services and equipment sales 15,056 14,387 7,611 4.7 —
Selling, general and administrative 11,447 11,647 7,349 (1.7) —
Depreciation and amortization 6,436 6,575 3,077 (2.1) —
Total Segment Operating Expenses 32,939 32,609 18,037 1.0 —
Segment Operating Income 4,567 1,824 1,528 — 19.4
Interest Expense 1,186 1,260 900 (5.9) 40.0
Equity in Net Income (Loss) of Affiliates — 5 (415) — —
Other – net (139) (38) (70) — 45.7
Segment Income $ 3,242 $ 531 $ 143 — —
1
AT&T Mobility’s 2005 operating revenue and expense percentage increases and decreases are not considered meaningful due to AT&T Mobility’s fourth-quarter 2004 acquisition
of AWE and are denoted with a dash.
Wireless Customer and Operating Trends
As of December 31, 2006, we served 61.0 million wireless
customers, compared to 54.1 million at December 31, 2005
and 49.1 million at December 31, 2004. Wireless customer
net additions increased 37.7% in 2006 and 50.0% in 2005
with 54% of the 2006 net additions coming from postpaid
customers, 28% from resellers and 18% from prepaid
customers. Postpaid customer growth was driven by lower
churn, which benefited from network and customer service
improvements and continued high levels of advertising over
the past year. Also contributing to the increase in net
additions was a significant increase in prepaid gross additions.
Gross customer additions were 19.2 million in 2006 and
18.5 million in 2005. Postpaid customer gross additions
declined due to the streamlining of operations, such as the
reduction of retail stores and agents, and fewer customers
switching to AT&T Mobility from other providers related to
lower industry churn.
Competition, lower industry churn and increased wireless
penetration as the wireless market matures will continue to
impact wireless gross additions, revenue growth, expenses
and put pressure on margins. We expect that future revenue
growth will become increasingly dependent on minimizing
customer turnover (customer churn) and on increasing service
average revenue per user/customer (ARPU).
Our wireless segment ARPU has weakened slightly over
the past several years, as we have offered a broader array of
plans to expand our customer base, including increased
growth among lower-ARPU prepaid and reseller customers.
We have also responded to increasing competition, resulting
in pricing reductions. Additionally, the increase in prepaid and
reseller customers over the past year has contributed to the
decline in ARPU. We expect continued pressure on ARPU,
despite our increasing revenue from data services.
Accounting for AT&T Mobility
The wireless segment reflects 100% of the results reported by
AT&T Mobility (formerly Cingular), which was our wireless joint
venture with BellSouth prior to the December 29, 2006
acquisition and became a wholly-owned subsidiary of AT&T.
Prior to the acquisition of BellSouth, we accounted for our
60% economic interest in our AT&T Mobility joint venture
under the equity method of accounting in our consolidated
financial statements. This means that for periods prior to the
acquisition, our consolidated results included AT&T Mobility’s
results in the “Equity in net income of affiliates” line. Once the
acquisition closed and AT&T Mobility became a wholly-owned
subsidiary, GAAP requires that results from the wireless
segment be included as operating revenues and expenses
in our consolidated results. Accordingly, results from this
segment for the last two days of 2006 were included as
operating revenues and expenses and not in the “Equity in
net income of affiliates” line.
When analyzing our segment results, we evaluate AT&T
Mobility’s results on a stand-alone basis using information
provided by AT&T Mobility during the year. For periods before
the acquisition, including 100% of AT&T Mobility’s results in
our wireless segment operations (rather than 60% in equity
in net income of affiliates) affected the presentation of this
segment’s revenues, expenses, operating income, nonoperating
items and segment income but did not affect our consolidated
net income.
Acquisition of AT&T Wireless Services, Inc. (AWE)
On October 26, 2004, AT&T Mobility acquired AWE for approxi-
mately $41,000 in cash. We and BellSouth funded, by means
of an equity contribution to AT&T Mobility, a significant portion
of the acquisition’s purchase price. Based on our 60% equity
ownership of AT&T Mobility, and after taking into account cash
on hand at AWE, we provided approximately $21,600 to fund
the purchase price.