AT&T Wireless 2006 Annual Report Download - page 51
Download and view the complete annual report
Please find page 51 of the 2006 AT&T Wireless annual report below. You can navigate through the pages in the report by either clicking on the pages listed below, or by using the keyword search tool below to find specific information within the annual report.-
 1
1 -
2
-
3
-
4
-
5
-
6
-
7
-
8
-
9
-
10
-
11
-
12
-
13
-
14
-
15
-
16
-
17
-
18
-
19
-
20
-
21
-
22
-
23
-
24
-
25
-
26
-
27
-
28
-
29
-
30
-
31
-
32
-
33
-
34
-
35
-
36
-
37
-
38
-
39
-
40
-
 41
41 -
 42
42 -
 43
43 -
 44
44 -
 45
45 -
 46
46 -
 47
47 -
 48
48 -
 49
49 -
 50
50 -
 51
51 -
 52
52 -
 53
53 -
 54
54 -
 55
55 -
 56
56 -
 57
57 -
 58
58 -
 59
59 -
 60
60 -
 61
61 -
62
-
63
-
64
-
65
-
66
-
67
-
68
-
69
-
70
-
71
-
72
-
73
-
74
-
75
-
76
-
77
-
78
-
79
-
80
-
81
-
82
-
83
-
84
-
85
-
86
-
87
-
88
 |
 |

2006 AT&T Annual Report : :
49
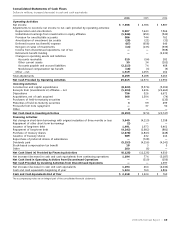
Consolidated Statements of Cash Flows
Dollars in millions, increase (decrease) in cash and cash equivalents
2006 2005 2004
Operating Activities
Net income $ 7,356 $ 4,786 $ 5,887
Adjustments to reconcile net income to net cash provided by operating activities:
Depreciation and amortization 9,907 7,643 7,564
Undistributed earnings from investments in equity affiliates (1,946) (451) (542)
Provision for uncollectible accounts 586 744 761
Amortization of investment tax credits (28) (21) (32)
Deferred income tax (benefit) expense (87) (658) 646
Net gain on sales of investments (10) (135) (939)
Income from discontinued operations, net of tax — — (908)
Retirement benefit funding — — (2,232)
Changes in operating assets and liabilities:
Accounts receivable 519 (94) 282
Other current assets 30 34 (102)
Accounts payable and accrued liabilities (2,213) 74 408
Stock-based compensation tax benefit (18) (3) (5)
Other – net 1,519 1,055 162
Total adjustments 8,259 8,188 5,063
Net Cash Provided by Operating Activities 15,615 12,974 10,950
Investing Activities
Construction and capital expenditures (8,320) (5,576) (5,099)
Receipts from (investments in) affiliates – net (1,104) 2,436 (22,660)
Dispositions 756 526 6,672
Acquisitions, net of cash acquired 368 1,504 (74)
Purchases of held-to-maturity securities — — (135)
Maturities of held-to-maturity securities 3 99 499
Proceeds from note repayment — 37 50
Other 4 — —
Net Cash Used in Investing Activities (8,293) (974) (20,747)
Financing Activities
Net change in short-term borrowings with original maturities of three months or less 3,649 (4,119) 3,398
Repayment of other short-term borrowings (2) — —
Issuance of long-term debt 1,491 1,973 6,461
Repayment of long-term debt (4,242) (2,682) (881)
Purchase of treasury shares (2,678) (1,843) (448)
Issuance of treasury shares 589 432 216
Repurchase of preferred shares of subsidiaries — (728) —
Dividends paid (5,153) (4,256) (4,141)
Stock-based compensation tax benefit 18 3 5
Other 200 (6) —
Net Cash (Used in) Provided by Financing Activities (6,128) (11,226) 4,610
Net increase (decrease) in cash and cash equivalents from continuing operations 1,194 774 (5,187)
Net Cash Used in Operating Activities from Discontinued Operations — (310) (256)
Net Cash Provided by Investing Activities from Discontinued Operations — — 1,397
Net increase (decrease) in cash and cash equivalents 1,194 464 (4,046)
Cash and cash equivalents beginning of year 1,224 760 4,806
Cash and Cash Equivalents End of Year $ 2,418 $ 1,224 $ 760
The accompanying notes are an integral part of the consolidated financial statements.