AT&T Wireless 2006 Annual Report Download - page 31
Download and view the complete annual report
Please find page 31 of the 2006 AT&T Wireless annual report below. You can navigate through the pages in the report by either clicking on the pages listed below, or by using the keyword search tool below to find specific information within the annual report.-
 1
1 -
2
-
3
-
4
-
5
-
6
-
7
-
8
-
9
-
10
-
11
-
12
-
13
-
14
-
15
-
16
-
17
-
18
-
19
-
20
-
 21
21 -
 22
22 -
 23
23 -
 24
24 -
 25
25 -
 26
26 -
 27
27 -
 28
28 -
 29
29 -
 30
30 -
 31
31 -
 32
32 -
 33
33 -
 34
34 -
 35
35 -
 36
36 -
 37
37 -
 38
38 -
 39
39 -
 40
40 -
 41
41 -
42
-
43
-
44
-
45
-
46
-
47
-
48
-
49
-
50
-
51
-
52
-
53
-
54
-
55
-
56
-
57
-
58
-
59
-
60
-
61
-
62
-
63
-
64
-
65
-
66
-
67
-
68
-
69
-
70
-
71
-
72
-
73
-
74
-
75
-
76
-
77
-
78
-
79
-
80
-
81
-
82
-
83
-
84
-
85
-
86
-
87
-
88
 |
 |

2006 AT&T Annual Report : :
29
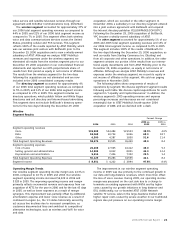
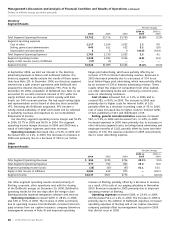
Our other segment includes our 60% proportionate share
of AT&T Mobility results as equity in net income of affiliates.
With the December 29, 2006 close of the BellSouth merger,
we own 100% of AT&T Mobility and its results for the final
two days of the year have been excluded from equity in net
income of affiliates. Our other segment also includes our
equity investments in international companies, the income
from which we report as equity in net income of affiliates. Our
earnings from foreign affiliates are sensitive to exchange-rate
changes in the value of the respective local currencies. Our
foreign investments are recorded under GAAP, which include
adjustments for the purchase method of accounting and
exclude certain adjustments required for local reporting in
specific countries. Our equity in net income of affiliates by
major investment is listed below:
2006 2005 2004
AT&T Mobility $1,508 $200 $ 30
América Móvil 274 198 132
Telmex 222 212 180
TDC1 — — 328
Telkom South Africa1 — — 115
Other 56 4 88
Other Segment Equity in Net
Income of Affiliates $2,060 $614 $873
1Investment sold in 2004.
Equity in net income of affiliates increased $1,446 in 2006
primarily due to the improved operating results at AT&T
Mobility. Equity in net income decreased $259, or 29.7%, in
2005 due primarily to foregone equity income from the
disposition of investments.
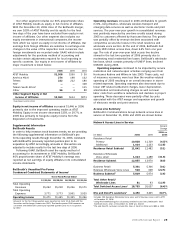
Supplemental Information
BellSouth Results
In order to help investors track business trends, we are providing
the following supplemental information on BellSouth’s pro
forma operating results through December 31, 2006, consistent
with BellSouth’s previously reported quarters prior to its
acquisition by AT&T. Accordingly, amounts in this section are
adjusted to include results for the last two days of 2006.
Following GAAP, BellSouth used the equity method of
accounting for its investment in AT&T Mobility. BellSouth’s
40% proportionate share of AT&T Mobility’s earnings was
reported as net earnings of equity affiliates in its consolidated
income statements.
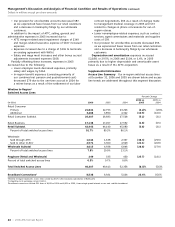
BellSouth’s Unaudited Pro Forma
Condensed Combined Statements of Income1
Three-Month Period Ended
12/31/06 09/30/06 06/30/06 03/31/06
Total Operating
Revenues $5,242 $5,218 $5,206 $5,171
Total Operating
Expenses 3,771 3,773 3,901 3,925
Operating Income $1,471 $1,445 $1,305 $1,246
1
Amounts for the first three quarters were reported on Form 10-Q, filed with the
Securities and Exchange Commission (SEC). The fourth-quarter 2006 amounts are
consistent with BellSouth’s previously reported quarters prior to its acquisition
by AT&T.
Operating revenues increased in 2006 attributable to growth
in DSL, long distance, wholesale wireless transport and
emerging data services as well as electronic media and print
services. The year-over-year growth in consolidated revenues
was positively impacted by one-time credits issued during
2005 to customers affected by Hurricane Katrina. This growth
was partially offset by revenue declines associated with
competitive access line losses in the retail residence and
wholesale voice sectors. At the end of 2006, BellSouth had
nearly 18.8 million access lines, down 6.4% from one year
ago. The rate of year-over-year total access line decline
slowed in the last two quarters of 2006 primarily due to
moderating retail residential line losses. BellSouth’s wholesale
line base, which consists primarily of UNE-P lines, declined
638,000 during 2006.
Operating expenses continued to be impacted by service
restoration and network-repair activities carrying over from
Hurricanes Katrina and Wilma in late 2005. These costs, net
of insurance recoveries, were less than the weather-related
spending of 2005 resulting in an overall decrease in storm-
related expenses. Operating expenses also decreased due to
lower USF related settlement charges, lower depreciation,
amortization and restructuring charges as well as lower
labor costs from workforce reductions and declines in project
spending. These decreases were partially offset by costs
associated with the AT&T merger and expansion and growth
of electronic media and print services.
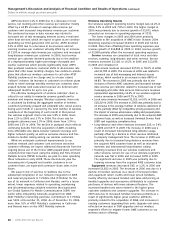
Access Line Summary
BellSouth’s Communications Group network access lines in
service at December 31, 2006 and 2005 are shown below:
Network Access Lines in Service
Percent
Change
2006 vs.
(In 000s) 2006 2005 2005
Residence Retail
Primary 10,828 11,319 (4.3)%
Additional 1,014 1,163 (12.8)
Residence Retail Subtotal 11,842 12,482 (5.1)
Residence Wholesale
Voice Lines1 1,013 1,488 (31.9)
Residence Subtotal 12,855 13,970 (8.0)
Business Retail 5,301 5,306 (0.1)
Business Wholesale Voice Lines 518 668 (22.5)
Business Subtotal1 5,819 5,974 (2.6)
Total Other Retail/
Wholesale Lines 81 93 (12.9)
Total Switched Access Lines2 18,755 20,037 (6.4)%
DSL and DirecTV customers3 4,450 3,405 30.7%
1 Includes 205 Residence Wholesale Voice Lines and 57 Business Lines sold to ATTC
at December 31, 2006.
2 Using AT&T methodology for calculating switched access lines, BellSouth’s Total
Switched Access Lines at December 31, 2006 was 20,163.
3 DSL and DirecTV customers include DSL lines of 3,632 in 2006 and 2,882 in 2005.