AT&T Wireless 2006 Annual Report Download - page 61
Download and view the complete annual report
Please find page 61 of the 2006 AT&T Wireless annual report below. You can navigate through the pages in the report by either clicking on the pages listed below, or by using the keyword search tool below to find specific information within the annual report.-
 1
1 -
2
-
3
-
4
-
5
-
6
-
7
-
8
-
9
-
10
-
11
-
12
-
13
-
14
-
15
-
16
-
17
-
18
-
19
-
20
-
21
-
22
-
23
-
24
-
25
-
26
-
27
-
28
-
29
-
30
-
31
-
32
-
33
-
34
-
35
-
36
-
37
-
38
-
39
-
40
-
41
-
42
-
43
-
44
-
45
-
46
-
47
-
48
-
49
-
50
-
 51
51 -
 52
52 -
 53
53 -
 54
54 -
 55
55 -
 56
56 -
 57
57 -
 58
58 -
 59
59 -
 60
60 -
 61
61 -
 62
62 -
 63
63 -
 64
64 -
 65
65 -
 66
66 -
 67
67 -
 68
68 -
 69
69 -
 70
70 -
 71
71 -
72
-
73
-
74
-
75
-
76
-
77
-
78
-
79
-
80
-
81
-
82
-
83
-
84
-
85
-
86
-
87
-
88
 |
 |

2006 AT&T Annual Report : :
59
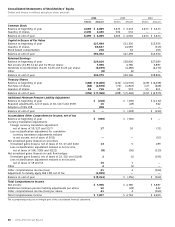
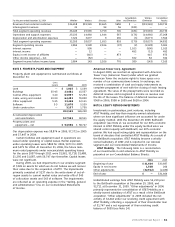
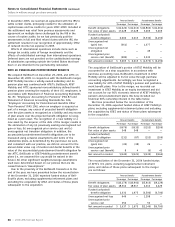
NOTE 3. EARNINGS PER SHARE
A reconciliation of the numerators and denominators of basic
earnings per share and diluted earnings per share for income
from continuing operations for the years ended December 31,
2006, 2005 and 2004 are shown in the table below:
Year Ended December 31, 2006 2005 2004
Numerators
Numerator for basic earnings
per share:
Income from continuing
operations $7,356 $4,786 $4,979
Dilutive potential common shares:
Other stock-based compensation 7 10 9
Numerator for diluted
earnings per share $7,363 $4,796 $4,988
Denominators (000,000)
Denominator for basic earnings
per share:
Weighted average number
of common shares outstanding 3,882 3,368 3,310
Dilutive potential common shares:
Stock options 4 1 2
Other stock-based compensation 16 10 10
Denominator for diluted
earnings per share 3,902 3,379 3,322
Basic earnings per share
Income from continuing
operations $ 1.89 $ 1.42 $ 1.50
Income from discontinued
operations — — 0.28
Net income $ 1.89 $ 1.42 $ 1.78
Diluted earnings per share
Income from continuing
operations $ 1.89 $ 1.42 $ 1.50
Income from discontinued
operations — — 0.27
Net income $ 1.89 $ 1.42 $ 1.77
At December 31, 2006, 2005 and 2004, we had issued and
outstanding options to purchase approximately 309 million,
277 million and 214 million shares of AT&T common stock.
The exercise prices of options to purchase a weighted-average
of 201 million, 257 million and 191 million shares in 2006,
2005 and 2004, exceeded the average market price of AT&T
stock. Accordingly, we did not include these amounts in
determining the dilutive potential common shares for the
respective periods. At December 31, 2006, the exercise price
of 111 million share options were below market price; of
these options, 38 million will expire by the end of 2011.
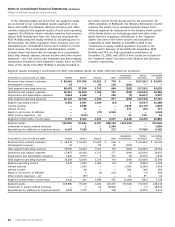
NOTE 4. SEGMENT INFORMATION
Our segments are strategic business units that offer different
products and services and are managed accordingly. As a
result of our November 18, 2005 acquisition of ATTC we
revised our segment reporting to represent how we now
manage our business, restating prior periods to conform to
the current segments. Due to the proximity of our BellSouth
acquisition to year-end, we have reported the two days of
results from BellSouth in the other segment even though
there may be some overlap in the products and services
provided by that segment and our wireline segment. Under
GAAP segment reporting rules, we analyze our various
operating segments based on segment income before income
taxes. Substantially all of our interest expense, interest
income, other income (expense) – net and income tax
expense are managed on a total company basis and are,
accordingly, reflected only in consolidated results. The custom-
ers and long-lived assets of our reportable segments are
predominantly in the United States. We have four reportable
segments that reflect the current management of our busi-
ness: (1) wireline, (2) wireless, (3) directory and (4) other.
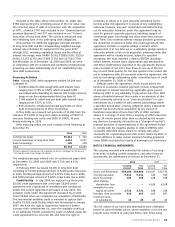
The wireline segment provides both retail and wholesale
landline telecommunications services, including local and
long-distance voice, switched access, IP and Internet access
data, messaging services, managed networking to business
customers, our U-verseSM video service and satellite television
services through our agreement with EchoStar Communica-
tions Corp. (EchoStar).
The wireless segment reflects 100% of the results reported
by AT&T Mobility, which was our wireless joint venture with
BellSouth prior to the December 29, 2006 acquisition and is
now a wholly-owned subsidiary of AT&T. Although we analyze
AT&T Mobility’s revenues and expenses under the wireless
segment, we eliminate all results from the wireless segment
prior to the acquisition in our consolidated financial state-
ments and report our 60% proportionate share of AT&T
Mobility’s results from that period as equity in net income of
affiliates. For segment reporting, we report this equity in net
income of affiliates in our other segment. The results from the
wireless segment for the two days following the acquisition
are now included in our Consolidated Statements of Income
and have not been eliminated.
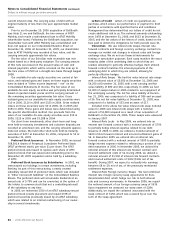
The directory segment includes our directory operations,
which publish Yellow and White Pages directories and sell
directory and Internet-based advertising. This segment does
not include BellSouth’s directory operations for the two days
following the December 29, 2006 acquisition, which are
recorded in the other segment. Results for this segment are
shown under the amortization method, which means that
revenues and direct expenses are recognized ratably over the
life of the directory title, typically 12 months. Results reflect
the September 2004 sale of our interest in the directory
advertising business in Illinois and northwest Indiana to
Donnelley (see Note 2). Our portion of the results from YPC is
recorded in this segment as equity in net income of affiliates.
YPC became a wholly-owned subsidiary of AT&T following the
December 29, 2006 acquisition of BellSouth.
The other segment includes results from BellSouth for the
two days following the December 29, 2006 acquisition, as well
as results from Sterling Commerce Inc. (Sterling) and from all
corporate and other operations. In addition, the other segment
contains our portion of the results from our international
equity investments and from AT&T Mobility, as discussed above.