AT&T Wireless 2006 Annual Report Download - page 28
Download and view the complete annual report
Please find page 28 of the 2006 AT&T Wireless annual report below. You can navigate through the pages in the report by either clicking on the pages listed below, or by using the keyword search tool below to find specific information within the annual report.-
 1
1 -
2
-
3
-
4
-
5
-
6
-
7
-
8
-
9
-
10
-
11
-
12
-
13
-
14
-
15
-
16
-
17
-
 18
18 -
 19
19 -
 20
20 -
 21
21 -
 22
22 -
 23
23 -
 24
24 -
 25
25 -
 26
26 -
 27
27 -
 28
28 -
 29
29 -
 30
30 -
 31
31 -
 32
32 -
 33
33 -
 34
34 -
 35
35 -
 36
36 -
 37
37 -
 38
38 -
39
-
40
-
41
-
42
-
43
-
44
-
45
-
46
-
47
-
48
-
49
-
50
-
51
-
52
-
53
-
54
-
55
-
56
-
57
-
58
-
59
-
60
-
61
-
62
-
63
-
64
-
65
-
66
-
67
-
68
-
69
-
70
-
71
-
72
-
73
-
74
-
75
-
76
-
77
-
78
-
79
-
80
-
81
-
82
-
83
-
84
-
85
-
86
-
87
-
88
 |
 |

26 : :
2006 AT&T Annual Report
Management’s Discussion and Analysis of Financial Condition and Results of Operations (continued)
Dollars in millions except per share amounts
ARPU declined 1.1% in 2006 due to a decrease in local
service, net roaming and other revenue per customer mostly
offset by a 44.8% increase in average data revenue per
customer and increased long-distance revenue per customer.
The continued increase in data revenue was related to
increased use of text messaging, Internet access, e-mail and
other data services, which we expect to grow as we continue
expanding our third-generation (3G) service. ARPU declined
0.1% in 2005 due to a decrease in local service and net
roaming revenue per customer virtually offset by an increase
of 115% in average data revenue per customer and increased
long-distance revenue per customer. In 2006, local service
revenue per customer declined primarily due to the addition
of a disproportionately higher percentage of prepaid and
reseller customers which provide significantly lower ARPU
than postpaid customers; customer shifts to all-inclusive rate
plans that offer lower monthly charges; free mobile-to-mobile
plans that allow our wireless customers to call other AT&T
Mobility customers at no charge and, to a lesser extent,
“rollover” minutes. An increase in customers on rollover plans
tends to lower average monthly revenue per customer, since
unused minutes (and associated revenue) are deferred until
subsequent months for up to one year.
The effective management of wireless customer churn is
critical to our ability to maximize revenue growth and to
maintain and improve margins. Wireless customer churn rate
is calculated by dividing the aggregate number of wireless
customers (primarily prepaid and postpaid) who cancel service
during each month in a period by the total number of wireless
customers at the beginning of each month in that period.
Our wireless segment churn rate was 1.8% in 2006, down
from 2.2% in 2005 and 2.7% in 2004. The churn rate for
postpaid customers was 1.5% in 2006, down from 1.9% in
2005 and 2.3% in 2004. The decline in postpaid churn reflects
continuing benefits from the acquisition of AWE, including
more affordable rate plans, broader network coverage and
higher network quality, as well as exclusive devices and free
mobile-to-mobile calling among our wireless customers.
While we anticipate continued improvements to our
wireless network and customer care and more attractive
customer offerings, we expect additional disconnects from the
ongoing phase out of the former AWE prepaid plans and from
customers that have been using the analog and Time Division
Multiple Access (TDMA) networks; we plan to cease operating
these networks in early 2008. These disconnects, plus the
increasing mix of prepaid and reseller customers in our
customer base, are expected to pressure churn rates in the
future.
We expect cost of services to stabilize due to the
substantial completion of our network integration of AWE
and reduced payments to T-Mobile USA (T-Mobile) for the
use of its network in California and Nevada, and to a lesser
extent, lower expenses related to operating, maintaining
and decommissioning outdated networks that duplicated
our Global System for Mobile Communication (GSM) net-
works while integrating networks acquired from AWE.
AT&T Mobility’s remaining purchase commitment to T-Mobile
was $202 at December 31, 2006. As of December 31, 2006,
more than 91% of AT&T Mobility’s customers in California
and Nevada were on the AT&T Mobility network.
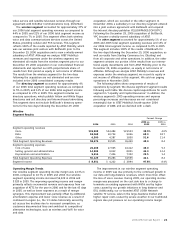
Wireless Operating Results
Our wireless segment operating income margin was 12.2% in
2006, 5.3% in 2005 and 7.8% in 2004. The higher margin in
2006 was primarily due to revenue growth of $3,073, which
exceeded our increase in operating expenses of $330.
The lower margins in 2005 and 2004 were primarily
attributable to the acquisition of AWE in late October 2004.
Operating expenses increased $14,572 in 2005 and $4,714
in 2004. More than offsetting these operating expenses was
revenue growth of $14,868 in 2005. In 2004, revenue growth
of $3,988 partially offset the increased operating expenses.
Service revenues are comprised of local voice and data
services, roaming, long-distance and other revenue. Service
revenues increased $3,118, or 10.2%, in 2006 and $13,036
in 2005 and consisted of:
• Data service revenues increased $1,579, or 59.0%, in 2006
and $1,785 in 2005. The increase in 2006 was related to
increased use of text messaging and Internet access
services, which resulted in an increase in data ARPU of
44.8%. The increase in 2005 was primarily due to the
inclusion of former AWE customers and increased average
data revenue per customer related to increased use of text
messaging and other data services. Data service revenues
represented approximately 12.6% of our wireless segment
service revenues in 2006 and 8.7% in 2005.
• Local voice revenues increased $1,515, or 6.0%, in 2006 and
$10,219 in 2005. The increase in 2006 was primarily due to
an increase in the average number of wireless customers of
11.5%, partially offset by competitive pricing pressures and
the impact of various all-inclusive calling and prepaid plans.
The increase in 2005 was primarily due to the acquired AWE
customer base, as well as increased Universal Service Fund
(USF) and regulatory compliance fees.
• Long-distance and other revenues increased $26, or 3.4%,
in 2006 and $377 in 2005. The increase in 2006 was a
result of increased international long-distance usage,
partially offset by a decline in other revenue attributed
to property management fees. The increase in 2005 was
primarily due to increased long-distance revenues from
the acquired AWE customer base as well as increased
domestic and international long-distance calling.
• Roaming revenues from our wireless customers and
other wireless carriers for use of our wireless segment’s
network was flat in 2006 and increased $655 in 2005.
The significant increase in 2005 was primarily due to
roaming revenues from the acquired AWE customer base.
Equipment revenues decreased $45, or 1.2%, in 2006 and
increased $1,832 in 2005. The decrease in 2006 was due to a
decline in handset revenues as a result of increased rebate
and equipment return credits and lower priced handsets,
mostly offset by increased handset unit sales and pricing on
handset upgrades and accessories attributable to customer
purchases of devices with more advanced features. The
increased handset unit sales related to the higher gross
customer additions and customer upgrades. The increase in
2005 was due to increased handset revenues primarily as a
result of significantly higher gross customer additions,
primarily related to the acquisition of AWE, and increases in
existing customers upgrading their units. Upgrade unit sales
reflected an increase in GSM upgrades and our wireless
segment’s efforts to migrate former AWE customers to our
wireless service offerings.