AT&T Wireless 2006 Annual Report Download - page 62
Download and view the complete annual report
Please find page 62 of the 2006 AT&T Wireless annual report below. You can navigate through the pages in the report by either clicking on the pages listed below, or by using the keyword search tool below to find specific information within the annual report.-
 1
1 -
2
-
3
-
4
-
5
-
6
-
7
-
8
-
9
-
10
-
11
-
12
-
13
-
14
-
15
-
16
-
17
-
18
-
19
-
20
-
21
-
22
-
23
-
24
-
25
-
26
-
27
-
28
-
29
-
30
-
31
-
32
-
33
-
34
-
35
-
36
-
37
-
38
-
39
-
40
-
41
-
42
-
43
-
44
-
45
-
46
-
47
-
48
-
49
-
50
-
51
-
 52
52 -
 53
53 -
 54
54 -
 55
55 -
 56
56 -
 57
57 -
 58
58 -
 59
59 -
 60
60 -
 61
61 -
 62
62 -
 63
63 -
 64
64 -
 65
65 -
 66
66 -
 67
67 -
 68
68 -
 69
69 -
 70
70 -
 71
71 -
 72
72 -
73
-
74
-
75
-
76
-
77
-
78
-
79
-
80
-
81
-
82
-
83
-
84
-
85
-
86
-
87
-
88
 |
 |

60 : :
2006 AT&T Annual Report
Notes to Consolidated Financial Statements (continued)
Dollars in millions except per share amounts
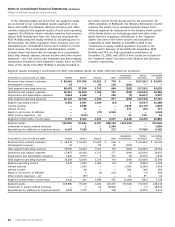
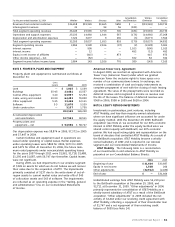
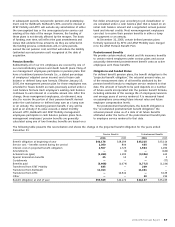
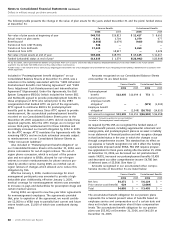
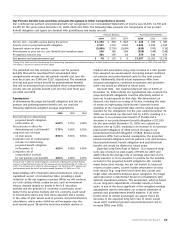
In the following tables, we show how our segment results
are reconciled to our consolidated results reported in accor-
dance with GAAP. The Wireline, Wireless, Directory and Other
columns represent the segment results of each such operating
segment. The Wireline column includes revenues from services
sold to AT&T Mobility (see Note 14). Since we accounted for
AT&T Mobility using the equity method of accounting prior to
the December 29, 2006 acquisition, these revenues were not
eliminated upon consolidation and as such, remain in consoli-
dated revenue. The Consolidation and Elimination column
includes those line items that we manage on a consolidated
basis only: interest expense, interest income and other income
(expense) – net. This column also eliminates any intercompany
transactions included in each segment’s results. Since our 60%
share of the results from AT&T Mobility is already included in
the Other column for the period prior to the December 29,
2006 acquisition of BellSouth, the Wireless Elimination column
removes the results of our wireless business shown in the
Wireless segment for that period. In the balance sheet section
of the tables below, we included goodwill and other intan-
gibles from the acquisition of BellSouth in the “Segment
assets” line item in the Other column and included our
investment in AT&T Mobility of $26,989 in 2005 in the
“Investment in equity method investees” line item in the
Other column. Because of the BellSouth acquisition, AT&T
Mobility and YPC are fully consolidated subsidiaries at
December 31, 2006, and 100% of their assets are included in
the “Segment assets” line item in the Wireless and Directory
columns, respectively.
Segment results, including a reconciliation to AT&T consolidated results, for 2006, 2005 and 2004 are as follows:
Consolidation Wireless Consolidated
At December 31, 2006 or for the year ended Wireline Wireless Directory Other and Elimination Elimination Results
Revenues from external customers $ 58,441 $37,506 $3,621 $ 778 $ — $(37,291) $ 63,055
Intersegment revenues 35 — 81 176 (292) — —
Total segment operating revenues 58,476 37,506 3,702 954 (292) (37,291) 63,055
Operations and support expenses 40,511 26,503 1,760 721 (292) (26,343) 42,860
Depreciation and amortization expenses 9,614 6,436 3 256 (1) (6,401) 9,907
Total segment operating expenses 50,125 32,939 1,763 977 (293) (32,744) 52,767
Segment operating income 8,351 4,567 1,939 (23) 1 (4,547) 10,288
Interest expense — 1,186 — — 1,836 (1,179) 1,843
Interest income — 20 — — 377 (20) 377
Equity in net income of affiliates — — (17) 2,060 — — 2,043
Other income (expense) – net — (159) — — 16 159 16
Segment income before income taxes 8,351 3,242 1,922 2,037 (1,442) (3,229) 10,881
Segment assets 102,891 97,634 4,107 288,103 (222,101) — 270,634
Investment in equity method investees — 1 — 1,994 — — 1,995
Expenditures for additions to long-lived assets 8,147 7,039 2 171 — (7,039) 8,320
Consolidation Wireless Consolidated
At December 31, 2005 or for the year ended Wireline Wireless Directory Other and Elimination Elimination Results
Revenues from external customers $ 39,475 $ 34,433 $ 3,625 $ 664 $ — $ (34,433) $ 43,764
Intersegment revenues 30 — 89 81 (200) — —
Total segment operating revenues 39,505 34,433 3,714 745 (200) (34,433) 43,764
Operations and support expenses 27,857 26,034 1,715 577 (196) (26,034) 29,953
Depreciation and amortization expenses 7,426 6,575 5 215 (3) (6,575) 7,643
Total segment operating expenses 35,283 32,609 1,720 792 (199) (32,609) 37,596
Segment operating income 4,222 1,824 1,994 (47) (1) (1,824) 6,168
Interest expense — 1,260 — — 1,456 (1,260) 1,456
Interest income — 49 — — 383 (49) 383
Equity in net income of affiliates — 5 (5) 614 — (5) 609
Other income (expense) – net — (87) — — 14 87 14
Segment income before income taxes 4,222 531 1,989 567 (1,060) (531) 5,718
Segment assets 105,880 79,319 4,041 129,257 (93,546) (79,319) 145,632
Investment in equity method investees — 7 64 28,956 — (7) 29,020
Expenditures for additions to long-lived assets 5,418 7,475 2 156 — (7,475) 5,576