ADT 2001 Annual Report Download - page 87
Download and view the complete annual report
Please find page 87 of the 2001 ADT annual report below. You can navigate through the pages in the report by either clicking on the pages listed below, or by using the keyword search tool below to find specific information within the annual report.-
 1
1 -
2
-
3
-
4
-
5
-
6
-
7
-
8
-
9
-
10
-
11
-
12
-
13
-
14
-
15
-
16
-
17
-
18
-
19
-
20
-
21
-
22
-
23
-
24
-
25
-
26
-
27
-
28
-
29
-
30
-
31
-
32
-
33
-
34
-
35
-
36
-
37
-
38
-
39
-
40
-
41
-
42
-
43
-
44
-
45
-
46
-
47
-
48
-
49
-
50
-
51
-
52
-
53
-
54
-
55
-
56
-
57
-
58
-
59
-
60
-
61
-
62
-
63
-
64
-
65
-
66
-
67
-
68
-
69
-
70
-
71
-
72
-
73
-
74
-
75
-
76
-
 77
77 -
 78
78 -
 79
79 -
 80
80 -
 81
81 -
 82
82 -
 83
83 -
 84
84 -
 85
85 -
 86
86 -
 87
87 -
 88
88 -
 89
89 -
 90
90 -
 91
91 -
 92
92 -
 93
93 -
 94
94
 |
 |

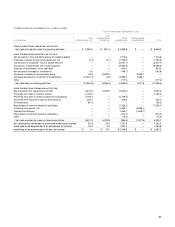
85
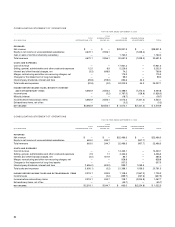
CONSOLIDATING STATEMENT OF CASH FLOWS
FOR THE YEAR ENDED SEPTEMBER 30, 2001
TYCO
TYCO INTERNATIONAL OTHER CONSOLIDATING
($ IN MILLIONS) INTERNATIONAL LTD. GROUP S.A. SUBSIDIARIES ADJUSTMENTS TOTAL
CASH FLOWS FROM OPERATING ACTIVITIES:
Net cash provided by (used in) operating activities $ 2,090.5 $ (291.1) $ 4,865.9 $
—
$ 6,665.3
CASH FLOWS FROM INVESTING ACTIVITIES:
Net decrease in Tyco Capital financing and leasing assets
——
1,513.6
—
1,513.6
Purchase of property, plant and equipment, net (0.2) (0.1) (1,794.0)
—
(1,794.3)
Construction in progress—TyCom Global Network
——
(2,247.7)
—
(2,247.7)
Acquisition of businesses, net of cash acquired
——
(9,694.6)
—
(9,694.6)
Disposal of businesses, net of cash sold
——
904.4
—
904.4
Net decrease (increase) in investments 5.9
—
(148.7)
—
(142.8)
Decrease (increase) in intercompany loans 54.8 (5,993.5)
—
5,938.7
—
(Increase) decrease in investment in subsidiaries (10,621.3) (2.8) 8,985.0 1,639.1
—
Other
——
(177.2)
—
(177.2)
Net cash used in investing activities (10,560.8) (5,996.4) (2,659.2) 7,577.8 (11,638.6)
CASH FLOWS FROM FINANCING ACTIVITIES:
Net proceeds from (repayments of) debt 3,374.9 6,320.9 (4,440.2)
—
5,255.6
Proceeds from sale of common shares 2,196.6
———
2,196.6
Proceeds from sale of common shares for acquisitions 2,729.4
—
(2,729.4)
——
Proceeds from exercise of options and warrants 226.6
—
318.4
—
545.0
Dividends paid (90.0)
———
(90.0)
Repurchase of common shares by subsidiary
——
(1,326.1)
—
(1,326.1)
Financing from parent, net
——
5,938.7 (5,938.7)
—
Capital contributions
——
1,639.1 (1,639.1)
—
Repurchase of common shares of subsidiary
——
(270.0)
—
(270.0)
Other
——
(15.4)
—
(15.4)
Net cash provided by (used in) financing activities 8,437.5 6,320.9 (884.9) (7,577.8) 6,295.7
NET (DECREASE) INCREASE IN CASH AND CASH EQUIVALENTS (32.8) 33.4 1,321.8
—
1,322.4
CASH AND CASH EQUIVALENTS AT BEGINNING OF PERIOD 34.2 3.6 1,227.0
—
1,264.8
CASH AND CASH EQUIVALENTS AT END OF PERIOD $ 1.4 $ 37.0 $ 2,548.8 $
—
$ 2,587.2