ADT 2001 Annual Report Download - page 30
Download and view the complete annual report
Please find page 30 of the 2001 ADT annual report below. You can navigate through the pages in the report by either clicking on the pages listed below, or by using the keyword search tool below to find specific information within the annual report.-
 1
1 -
2
-
3
-
4
-
5
-
6
-
7
-
8
-
9
-
10
-
11
-
12
-
13
-
14
-
15
-
16
-
17
-
18
-
19
-
 20
20 -
 21
21 -
 22
22 -
 23
23 -
 24
24 -
 25
25 -
 26
26 -
 27
27 -
 28
28 -
 29
29 -
 30
30 -
 31
31 -
 32
32 -
 33
33 -
 34
34 -
 35
35 -
 36
36 -
 37
37 -
 38
38 -
 39
39 -
 40
40 -
41
-
42
-
43
-
44
-
45
-
46
-
47
-
48
-
49
-
50
-
51
-
52
-
53
-
54
-
55
-
56
-
57
-
58
-
59
-
60
-
61
-
62
-
63
-
64
-
65
-
66
-
67
-
68
-
69
-
70
-
71
-
72
-
73
-
74
-
75
-
76
-
77
-
78
-
79
-
80
-
81
-
82
-
83
-
84
-
85
-
86
-
87
-
88
-
89
-
90
-
91
-
92
-
93
-
94
 |
 |

28
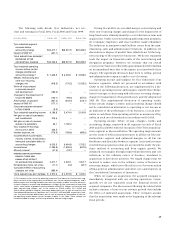
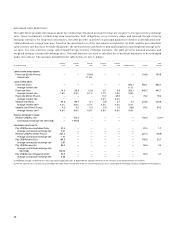
The following table sets forth revenue and operating
income and margins for the Healthcare and Specialty Products
segment:
($ IN MILLIONS) FISCAL 2001 FISCAL 2000 FISCAL 1999
Revenue, before
accounting change $8,833.3 $6,467.9 $5,742.7
Operating income, before
certain (charges) credits and
accounting change $2,070.6 $1,527.9 $1,386.0
Operating margins, before
certain (charges) credits and
accounting change 23.4% 23.6% 24.1%
Revenue, after
accounting change $8,812.7 $6,467.9 $5,742.7
Operating income, after certain
(charges) credits and
accounting change $1,804.4 $1,439.8 $ 890.9
Operating margins, after certain
(charges) credits and
accounting change 20.5% 22.3% 15.5%
The 36.6% increase in revenue, before accounting change,
in Fiscal 2001 over Fiscal 2000 resulted primarily from acquisi-
tions and, to a lesser extent, organic growth. These acquisitions
included: General Surgical Innovations, Inc. (“GSI”) in Novem-
ber 1999; Radionics in January 2000; Fiber-Lam in March 2000;
Mallinckrodt Inc. (“Mallinckrodt”) in October 2000; and Inner-
Dyne, Inc. (“InnerDyne”) in December 2000. The revenue
increase was somewhat offset by the sale of our ADT Automo-
tive business. Excluding the impact of these acquisitions and
this divestiture, revenue increased an estimated 5.9%.
The 12.6% increase in revenue in Fiscal 2000 over Fiscal
1999 was primarily the result of increased sales at Tyco Plastics
and Adhesives and Tyco Healthcare and, to a lesser extent, ADT
Automotive. The increases for Tyco Healthcare were due to
organic growth and, to a lesser extent, acquisitions. These acqui-
sitions included: Graphic Controls Corporation and Sunbelt
Plastics, both in November 1998; Batts, Inc. in April 1999; GSI
in November 1999; Radionics in January 2000; and Fiber-Lam in
March 2000. Excluding the impact of these acquisitions, revenue
for the segment increased an estimated 8.2% in Fiscal 2000 over
Fiscal 1999.
The 35.5% increase in operating income, before certain
(charges) credits and accounting change, and the slight
decrease in operating margins, before certain (charges) credits
and accounting change, in Fiscal 2001 compared to Fiscal 2000
was due to the acquisition of Mallinckrodt, which generally has
lower operating margins than other businesses in this segment.
Operating income and margins, after certain (charges)
credits and accounting change, include restructuring and other
non-recurring and impairment charges of $256.4 million, as well
as a decrease of $9.8 million relating to the adoption of SAB 101,
in Fiscal 2001, as compared to net merger, restructuring and
other non-recurring and impairment charges of $88.1 million in
Fiscal 2000.
The 10.2% increase in operating income, before certain
(charges) credits and accounting change, in Fiscal 2000 over
Fiscal 1999 was due to increased sales volume at Tyco Health-
care, Tyco Plastics and Adhesives and, to a lesser extent, ADT
Automotive, slightly offset by a lower operating margin per-
centage at Tyco Healthcare principally due to higher raw mate-
rials costs.
In addition to the items discussed above, the substantial
increase in operating income and margins, after certain
(charges) credits in Fiscal 2000 over Fiscal 1999, was due to net
merger, restructuring and other non-recurring and impairment
charges of $88.1 million in Fiscal 2000 compared with net
merger, restructuring and other non-recurring charges of
$495.1 million in Fiscal 1999.
Telecommunications
Tyco’s subsidiary, TyCom Ltd. (“TyCom”), is a leading indepen-
dent provider of undersea fiber optic networks and services, and
its products and services include:
• designing, engineering, manufacturing and installing under-
sea cable communications systems; and
• servicing and maintaining major undersea cable networks.
Beginning in the fourth quarter of Fiscal 2000, TyCom
began the design, manufacture and installation of a global
undersea fiber optic network, known as the TyCom Global
NetworkTM (“TGN”). In the third quarter of Fiscal 2001, TyCom
began operating, maintaining and selling bandwidth capacity
on the TGN.
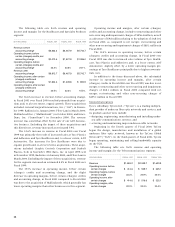
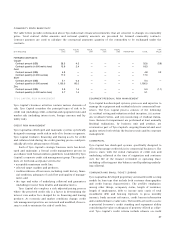
The following table sets forth revenue and operating
income and margins for the Telecommunications segment:
($ IN MILLIONS) FISCAL 2001 FISCAL 2000 FISCAL 1999
Revenue $1,863.2 $2,539.7 $1,623.8
Operating income, before
certain charges $ 414.6 $ 529.7 $ 325.1
Operating margins, before
certain charges 22.3% 20.9% 20.0%
Operating income, after
certain charges $ 414.6 $ 516.6 $ 325.1
Operating margins, after
certain charges 22.3% 20.3% 20.0%