ADT 2001 Annual Report Download - page 68
Download and view the complete annual report
Please find page 68 of the 2001 ADT annual report below. You can navigate through the pages in the report by either clicking on the pages listed below, or by using the keyword search tool below to find specific information within the annual report.-
 1
1 -
2
-
3
-
4
-
5
-
6
-
7
-
8
-
9
-
10
-
11
-
12
-
13
-
14
-
15
-
16
-
17
-
18
-
19
-
20
-
21
-
22
-
23
-
24
-
25
-
26
-
27
-
28
-
29
-
30
-
31
-
32
-
33
-
34
-
35
-
36
-
37
-
38
-
39
-
40
-
41
-
42
-
43
-
44
-
45
-
46
-
47
-
48
-
49
-
50
-
51
-
52
-
53
-
54
-
55
-
56
-
57
-
 58
58 -
 59
59 -
 60
60 -
 61
61 -
 62
62 -
 63
63 -
 64
64 -
 65
65 -
 66
66 -
 67
67 -
 68
68 -
 69
69 -
 70
70 -
 71
71 -
 72
72 -
 73
73 -
 74
74 -
 75
75 -
 76
76 -
 77
77 -
 78
78 -
79
-
80
-
81
-
82
-
83
-
84
-
85
-
86
-
87
-
88
-
89
-
90
-
91
-
92
-
93
-
94
 |
 |

66
As a result of the mergers with U.S. Surgical and AMP,
approximately 22.0 million options, which had not previously
been exercisable, became immediately exercisable when the
mergers were consummated.
TyCom has two option plans and an employee share pur-
chase plan. The exercise price of options granted under the plans
is equal to the fair market value at the date of grant of TyCom
common shares. TyCom has reserved 51.9 million common
shares for issuance under its option plans. At September 30,
2001, there were approximately 22.3 million shares available for
future grant. TyCom options outstanding and exercisable at Sep-
tember 30, 2001 were 29,559,490 and 6,170,984, respectively, at
prices ranging from $12.92 to $44.62 per share. TyCom options
outstanding and exercisable at September 30, 2000 were
21,607,050 and 26,250, respectively, at prices ranging from
$32.00 to $44.62 per share.
STOCK-BASED COMPENSATION
SFAS No. 123, “Accounting for Stock-Based Compensation,”
allows companies to measure compensation cost in connection
with employee share option plans using a fair value based
method, or to continue to use an intrinsic value based method,
which generally does not result in a compensation cost. Tyco and
TyCom continue to use the intrinsic value based method and do
not recognize compensation expense for the issuance of options
with an exercise price equal to or greater than the market price
at the time of grant. Had the fair value based method been
adopted by Tyco and TyCom, the Company’s pro forma net
income and pro forma net income per common share for Fiscal
2001, Fiscal 2000 and Fiscal 1999 would have been as follows:
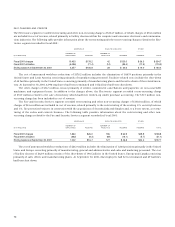
($ IN MILLIONS) 2001 2000 1999
Net income—pro forma $3,588.0 $4,136.7 $858.3
Net income per common
share—pro forma
Basic 1.99 2.45 0.52
Diluted 1.96 2.42 0.51
On the dates of grant using the Black-Scholes option-pric-
ing model and assumptions set forth below, the estimated
weighted-average fair value of Tyco and TyCom options granted
during Fiscal 2001 was $19.72 and $9.11, respectively; the esti-
mated weighted-average fair value of Tyco and TyCom options
granted during Fiscal 2000 was $16.26 and $17.47, respectively;
and the estimated weighted-average fair value of Tyco and
TyCom options granted during Fiscal 1999 was $12.13 and $7.11,
respectively.
The following weighted-average assumptions were used for
Fiscal 2001:
TYCO TYCOM
Expected stock price volatility 39% 80%
Risk free interest rate 5.18% 4.71%
Expected annual dividend yield per share $0.05
—
Expected life of options 4.4 years 4.0 years
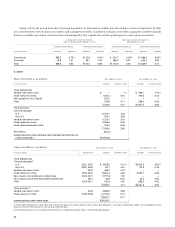
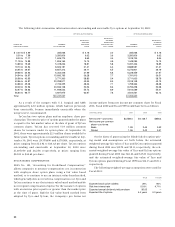
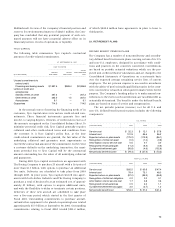
The following table summarizes information about outstanding and exercisable Tyco options at September 30, 2001:
OPTIONS OUTSTANDING OPTIONS EXERCISABLE
WEIGHTED-
WEIGHTED- AVERAGE WEIGHTED-
AVERAGE REMAINING AVERAGE
RANGE OF NUMBER EXERCISE CONTRACTUAL NUMBER EXERCISE
EXERCISE PRICES OUTSTANDING PRICE LIFE
—
YEARS EXERCISABLE PRICE
$ 0.00 to $ 4.99 385,068 $ 4.16 2.0 385,068 $ 4.16
5.00 to 7.99 3,280,806 6.62 3.6 3,280,806 6.62
8.00 to 11.77 1,626,775 9.63 4.4 1,519,735 9.54
11.78 to 14.88 1,806,165 14.15 4.9 1,449,285 14.13
14.89 to 19.69 5,478,226 18.81 5.8 5,397,426 18.85
19.70 to 24.94 8,926,181 21.41 6.4 8,888,581 21.41
24.95 to 29.87 8,857,313 28.11 6.5 6,273,801 28.19
29.88 to 34.93 6,362,446 31.99 6.8 6,228,459 31.97
34.94 to 36.97 15,893,795 36.28 7.7 1,791,910 36.51
36.98 to 40.95 3,771,360 38.80 5.4 3,711,630 38.79
40.96 to 44.87 20,298,911 43.55 8.5 2,518,148 43.13
44.88 to 49.48 2,746,355 48.36 7.1 1,798,363 48.28
49.49 to 52.96 23,936,138 50.56 8.6 8,794,258 50.38
52.97 to 56.83 11,949,523 55.73 8.9 5,812,589 55.41
56.84 to 98.77 4,927,975 63.97 7.8 3,504,561 63.13
Total 120,247,037 61,354,620