ADT 2001 Annual Report Download - page 71
Download and view the complete annual report
Please find page 71 of the 2001 ADT annual report below. You can navigate through the pages in the report by either clicking on the pages listed below, or by using the keyword search tool below to find specific information within the annual report.-
 1
1 -
2
-
3
-
4
-
5
-
6
-
7
-
8
-
9
-
10
-
11
-
12
-
13
-
14
-
15
-
16
-
17
-
18
-
19
-
20
-
21
-
22
-
23
-
24
-
25
-
26
-
27
-
28
-
29
-
30
-
31
-
32
-
33
-
34
-
35
-
36
-
37
-
38
-
39
-
40
-
41
-
42
-
43
-
44
-
45
-
46
-
47
-
48
-
49
-
50
-
51
-
52
-
53
-
54
-
55
-
56
-
57
-
58
-
59
-
60
-
 61
61 -
 62
62 -
 63
63 -
 64
64 -
 65
65 -
 66
66 -
 67
67 -
 68
68 -
 69
69 -
 70
70 -
 71
71 -
 72
72 -
 73
73 -
 74
74 -
 75
75 -
 76
76 -
 77
77 -
 78
78 -
 79
79 -
 80
80 -
 81
81 -
82
-
83
-
84
-
85
-
86
-
87
-
88
-
89
-
90
-
91
-
92
-
93
-
94
 |
 |

69
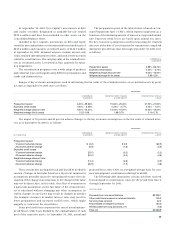
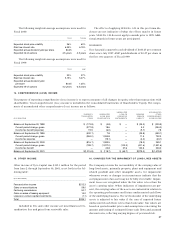
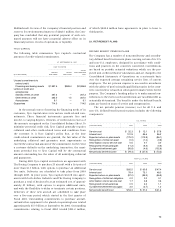
The computation of diluted earnings per common share in Fiscal 2001, Fiscal 2000 and Fiscal 1999 excludes the effect of the
assumed exercise of approximately 12.2 million, 7.3 million and 3.1 million stock options, respectively, that were outstanding as of
September 30, 2001, 2000 and 1999, respectively, because the effect would be anti-dilutive. Dilutive earnings per common share also
excludes 48.0 million and 26.4 million shares related to Tyco Industrial’s zero coupon convertible debentures due 2020 and 2021,
respectively, because conversion conditions were not met.
20. TYCOM LTD.
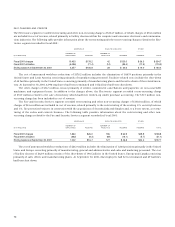
During Fiscal 2000, TyCom Ltd., a majority-owned subsidiary of the Company, completed an initial public offering (the “TyCom
IPO”) of 70,300,000 of its common shares at a price of $32.00 per share. Net proceeds to TyCom from the TyCom IPO, after deduct-
ing the underwriting discount, commissions and other direct costs, were approximately $2.1 billion. Of that amount, TyCom paid
$200 million as a dividend to the Company. Prior to the TyCom IPO, the Company’s ownership in TyCom’s outstanding common
shares was 100%, and at September 30, 2001 the Company’s ownership in TyCom’s outstanding common shares was approximately
89%. As a result of the TyCom IPO, the Company recognized a pre-tax gain on its investment in TyCom of approximately $1.76 bil-
lion ($1.01 billion, after-tax), which has been included in net gain on sale of common shares of subsidiary in the Fiscal 2000 Con-
solidated Statement of Operations.
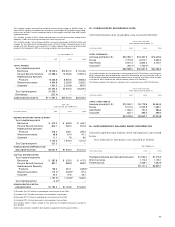
19. EARNINGS PER COMMON SHARE
The reconciliations between basic and diluted earnings per common share are as follows:
FOR THE YEAR ENDED FOR THE YEAR ENDED FOR THE YEAR ENDED
SEPTEMBER 30, 2001 SEPTEMBER 30, 2000 SEPTEMBER 30, 1999
($ IN MILLIONS, EXCEPT PER SHARE PER SHARE PER SHARE
PER SHARE DATA) INCOME SHARES AMOUNT INCOME SHARES AMOUNT LOSS SHARES AMOUNT
BASIC EARNINGS PER
COMMON SHARE:
Income from continuing
operations $4,671.1 1,806.9 $2.59 $4,520.1 1,688.0 $2.68 $1,067.7 1,641.3 $0.65
Stock options and warrants
—
21.4
—
21.2
—
23.3
Exchange of convertible debt
due 2010 1.1 3.3 1.5 4.0 3.9 10.2
DILUTED EARNINGS PER
COMMON SHARE:
Income from continuing
operations, giving effect
to dilutive adjustments $4,672.2 1,831.6 $2.55 $4,521.6 1,713.2 $2.64 $1,071.6 1,674.8 $0.64
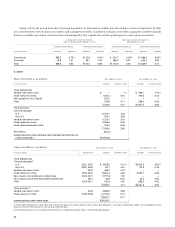
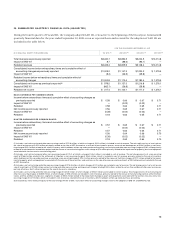
21. MERGER, RESTRUCTURING AND OTHER NON-RECURRING CHARGES, NET
Merger, restructuring and other non-recurring charges, net, are as follows:
($ IN MILLIONS) 2001 2000 1999
Electronics $ 386.4(1) $ (90.9)(4) $ 643.3(6)
Fire and Security Services 138.8(2) (11.2) (27.2)
Healthcare and Specialty Products 56.7(3) (10.9)(5) 419.1
Telecommunications
—
13.1
—
Corporate (163.4) 276.2
—
$ 418.5 $176.3 $1,035.2
(1) Includes $74.6 million charge related to the write-down of inventory associated with the exiting of business product lines and $51.7 million charge related to the sale of inventory which
had been written-up under purchase accounting, both of which are included in cost of revenue.
(2) Includes $14.6 million charge related to the write-down of inventory, which is included in cost of revenue.
(3) Includes $35.0 million charge related to the sale of inventory which had been written-up under purchase accounting and $9.0 million related to the impairment of inventory, both of
which are included in cost of revenue.
(4) Includes $0.9 million charge related to the write-down of inventory, which is included in cost of revenue, and a credit of $6.3 million also included in cost of revenue.
(5) Includes $6.4 million charge related to the write-down of inventory, which is included in cost of revenue.
(6) Includes $106.4 million charge related to the write-down of inventory, which is included in cost of revenue.