ADT 2001 Annual Report Download - page 25
Download and view the complete annual report
Please find page 25 of the 2001 ADT annual report below. You can navigate through the pages in the report by either clicking on the pages listed below, or by using the keyword search tool below to find specific information within the annual report.-
 1
1 -
2
-
3
-
4
-
5
-
6
-
7
-
8
-
9
-
10
-
11
-
12
-
13
-
14
-
 15
15 -
 16
16 -
 17
17 -
 18
18 -
 19
19 -
 20
20 -
 21
21 -
 22
22 -
 23
23 -
 24
24 -
 25
25 -
 26
26 -
 27
27 -
 28
28 -
 29
29 -
 30
30 -
 31
31 -
 32
32 -
 33
33 -
 34
34 -
 35
35 -
36
-
37
-
38
-
39
-
40
-
41
-
42
-
43
-
44
-
45
-
46
-
47
-
48
-
49
-
50
-
51
-
52
-
53
-
54
-
55
-
56
-
57
-
58
-
59
-
60
-
61
-
62
-
63
-
64
-
65
-
66
-
67
-
68
-
69
-
70
-
71
-
72
-
73
-
74
-
75
-
76
-
77
-
78
-
79
-
80
-
81
-
82
-
83
-
84
-
85
-
86
-
87
-
88
-
89
-
90
-
91
-
92
-
93
-
94
 |
 |

2323
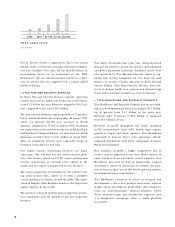
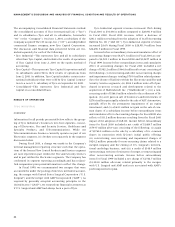
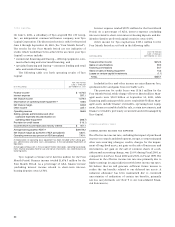
SELECTED FINANCIAL DATA
The following table sets forth selected consolidated financial information of Tyco as at and for the fiscal years ended September 30,
2001, 2000, 1999 and 1998 and the nine-month fiscal period ended September 30, 1997. This selected financial information should
be read in conjunction with Tyco’s Consolidated Financial Statements and related notes. The selected financial data reflect the
combined results of operations and financial position of Tyco, AMP Incorporated, United States Surgical Corporation, Former Tyco
(as defined in Note 7 below), Keystone International, Inc. and Inbrand Corporation restated for all periods presented pursuant to
the pooling of interests method of accounting. See Notes 1 and 3 to the Consolidated Financial Statements.
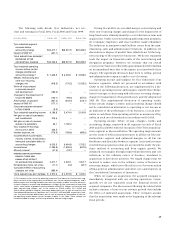
NINE MONTHS
YEAR ENDED ENDED
SEPTEMBER 30, SEPTEMBER 30,
(IN MILLIONS, EXCEPT PER SHARE DATA) 2001(2) 2000(3) 1999(4) 1998(5) 1997(6)(7)
Consolidated Statements of Operations Data:
Total revenues(1) $36,388.5 $30,691.9 $22,496.5 $19,061.7 $12,742.5
Income (loss) from continuing operations 4,671.1 4,520.1 1,067.7 1,168.6 (348.5)
Income (loss) from continuing operations per
common share(8):
Basic 2.59 2.68 0.65 0.74 (0.24)
Diluted 2.55 2.64 0.64 0.72 (0.24)
Cash dividends per common share(8) See (9) below.
Consolidated Balance Sheet Data (End of Period):
Total assets $111,287.3 $40,404.3 $32,344.3 $23,440.7 $16,960.8
Long-term debt 38,243.1 9,461.8 9,109.4 5,424.7 2,785.9
Mandatorily redeemable preferred securities 260.0
————
Shareholders’ equity 31,737.4 17,033.2 12,369.3 9,901.8 7,478.7
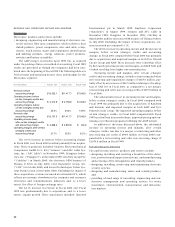
(1) In fiscal 2001, we changed our revenue recognition accounting policy to conform with the requirements of Staff Accounting Bulletin No. 101 issued by the Staff of the Securities and
Exchange Commission, as more fully described in Note 18 to the Consolidated Financial Statements.
(2) Income from continuing operations in the fiscal year ended September 30, 2001 includes a net charge of $418.5 million, of which $184.9 million is included in cost of revenue, for restruc-
turing and other non-recurring charges, a charge for the write-off of in-process research and development of $184.3 million and charges of $120.1 million for the impairment of long-lived
assets. See Notes 2, 16 and 21 to the Consolidated Financial Statements. Income from continuing operations for the fiscal year ended September 30, 2001 also includes a net gain on sale
of businesses and investments of $276.6 million and a net gain on the sale of common shares of a subsidiary of $64.1 million.
(3) Income from continuing operations in the fiscal year ended September 30, 2000 includes a net charge of $176.3 million, of which $1.0 million is included in cost of revenue, for restruc-
turing and other non-recurring charges, and charges of $99.0 million for the impairment of long-lived assets. See Notes 16 and 21 to the Consolidated Financial Statements. Income from
continuing operations for the fiscal year ended September 30, 2000 also includes a one-time pre-tax gain of $1,760.0 million related to the sale by a subsidiary of its common shares. See
Note 20 to the Consolidated Financial Statements.
(4) Income from continuing operations in the fiscal year ended September 30, 1999 is net of charges of $1,035.2 million for merger, restructuring and other non-recurring charges, of which
$106.4 million is included in cost of revenue, and charges of $507.5 million for the impairment of long-lived assets related to the mergers with U.S. Surgical and AMP and AMP’s profit improve-
ment plan. See Notes 16 and 21 to the Consolidated Financial Statements.
(5) Income from continuing operations in the fiscal year ended September 30, 1998 is net of charges of $80.5 million related primarily to costs to exit certain businesses in U.S. Surgical’s
operations and restructuring charges of $12.0 million related to the continuing operations of U.S. Surgical. In addition, AMP recorded restructuring charges of $185.8 million in connection
with its profit improvement plan and a credit of $21.4 million to restructuring charges representing a revision of estimates related to its 1996 restructuring activities.
(6) In September 1997, Tyco changed its fiscal year end from December 31 to September 30. Accordingly, the nine-month transition period ended September 30, 1997 is presented.
(7) In July 1997, a wholly-owned subsidiary of what was formerly called ADT Limited (“ADT”) merged with Tyco International Ltd., a Massachusetts Corporation at the time (“Former Tyco”).
Upon consummation of the merger, ADT (the continuing public company) changed its name to Tyco International Ltd. Former Tyco became a wholly-owned subsidiary of the Company and
changed its name to Tyco International (US) Inc. (“Tyco US”). Income from continuing operations in the nine months ended September 30, 1997 is net of charges related to merger, restruc-
turing and other non-recurring costs of $917.8 million and impairment of long-lived assets of $148.4 million related primarily to the mergers and integration of ADT, Former Tyco, Keystone,
and Inbrand, and charges of $24.3 million for litigation and other related costs and $5.8 million for restructuring charges in U.S. Surgical’s operations. The results for the nine months ended
September 30, 1997 also include a charge of $361.0 million for the write-off of purchased in-process research and development related to the acquisition of the submarine systems business
of AT&T Corp.
(8) Per share amounts have been retroactively restated to give effect to the mergers with Former Tyco, Keystone, Inbrand, U.S. Surgical and AMP; a 0.48133 reverse stock split (1.92532 after
giving effect to the subsequent stock splits) effected on July 2, 1997; and two-for-one stock splits on October 22, 1997 and October 21, 1999, both of which were effected in the form of a
stock dividend.
(9) Tyco has paid a quarterly cash dividend of $0.0125 per common share since July 2, 1997, the date of the Former Tyco/ADT merger. Prior to the merger with ADT, Former Tyco had paid a
quarterly cash dividend of $0.0125 per share of common stock since January 1992. ADT had not paid any dividends on its common shares since 1992. U.S. Surgical paid quarterly dividends
of $0.04 per share in the year ended September 30, 1998 and the nine months ended September 30, 1997. AMP paid dividends of $0.27 per share in the first two quarters of the year ended
September 30, 1999, $0.26 per share in the first quarter and $0.27 per share in the last three quarters of the year ended September 30, 1998, $0.26 per share in each of the three quarters of
the nine months ended September 30, 1997. The payment of dividends by Tyco in the future will depend on business conditions, Tyco’s financial condition and earnings and other factors.