ADT 2001 Annual Report Download - page 69
Download and view the complete annual report
Please find page 69 of the 2001 ADT annual report below. You can navigate through the pages in the report by either clicking on the pages listed below, or by using the keyword search tool below to find specific information within the annual report.-
 1
1 -
2
-
3
-
4
-
5
-
6
-
7
-
8
-
9
-
10
-
11
-
12
-
13
-
14
-
15
-
16
-
17
-
18
-
19
-
20
-
21
-
22
-
23
-
24
-
25
-
26
-
27
-
28
-
29
-
30
-
31
-
32
-
33
-
34
-
35
-
36
-
37
-
38
-
39
-
40
-
41
-
42
-
43
-
44
-
45
-
46
-
47
-
48
-
49
-
50
-
51
-
52
-
53
-
54
-
55
-
56
-
57
-
58
-
 59
59 -
 60
60 -
 61
61 -
 62
62 -
 63
63 -
 64
64 -
 65
65 -
 66
66 -
 67
67 -
 68
68 -
 69
69 -
 70
70 -
 71
71 -
 72
72 -
 73
73 -
 74
74 -
 75
75 -
 76
76 -
 77
77 -
 78
78 -
 79
79 -
80
-
81
-
82
-
83
-
84
-
85
-
86
-
87
-
88
-
89
-
90
-
91
-
92
-
93
-
94
 |
 |

67
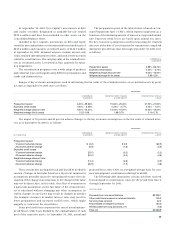
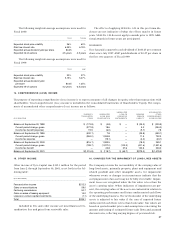
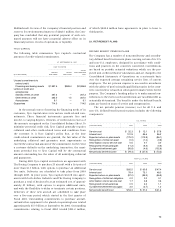
The following weighted-average assumptions were used for
Fiscal 2000:
TYCO TYCOM
Expected stock price volatility 36% 60%
Risk free interest rate 6.35% 6.19%
Expected annual dividend yield per share $0.05
—
Expected life of options 4.5 years 4.5 years
The following weighted-average assumptions were used for
Fiscal 1999:
TYCO AMP
Expected stock price volatility 30% 27%
Risk free interest rate 5.15% 5.07%
Expected annual dividend yield
per share $0.05 1.25%
Expected life of options 4.2 years 6.5 years
The effects of applying SFAS No. 123 in this pro forma dis-
closure are not indicative of what the effects may be in future
years. SFAS No. 123 does not apply to awards prior to 1995. Addi-
tional awards in future years are anticipated.
DIVIDENDS
Tyco has paid a quarterly cash dividend of $0.0125 per common
share since July 1997. AMP paid dividends of $0.27 per share in
the first two quarters of Fiscal 1999.
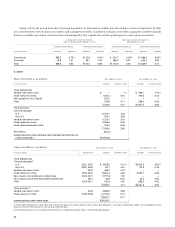
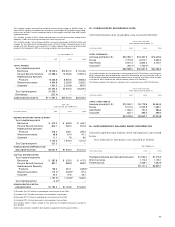
14. COMPREHENSIVE (LOSS) INCOME
The purpose of reporting comprehensive (loss) income is to report a measure of all changes in equity, other than transactions with
shareholders. Total comprehensive (loss) income is included in the Consolidated Statements of Shareholders’ Equity. The compo-
nents of accumulated other comprehensive (loss) income are as follows:
UNREALIZED ACCUMULATED
CURRENCY UNREALIZED LOSS ON MINIMUM OTHER
TRANSLATION (LOSS) GAIN DERIVATIVE PENSION COMPREHENSIVE
($ IN MILLIONS) ITEMS ON SECURITIES INSTRUMENTS LIABILITY (LOSS) INCOME
Balance at September 30, 1998 $ (173.8) $ (4.8) $
—
$ (25.3) $ (203.9)
Current period change, gross (277.8) 18.6
—
5.2 (254.0)
Income tax benefit (expense) 19.5 (6.0)
—
(5.7) 7.8
Balance at September 30, 1999 (432.1) 7.8
—
(25.8) (450.1)
Current period change, gross (384.0) 1,094.8
—
11.5 722.3
Income tax expense
—
(19.1)
—
(4.0) (23.1)
Balance at September 30, 2000 (816.1) 1,083.5
—
(18.3) 249.1
Current period change, gross (199.7) (1,227.0) (103.3) (401.6) (1,931.6)
Income tax benefit
—
24.8 37.6 140.6 203.0
Balance at September 30, 2001 $(1,015.8) $ (118.7) $ (65.7) $(279.3) $(1,479.5)
16. CHARGES FOR THE IMPAIRMENT OF LONG-LIVED ASSETS
The Company reviews the recoverability of the carrying value of
long-lived assets, primarily property, plant and equipment and
related goodwill and other intangible assets, for impairment
whenever events or changes in circumstances indicate that the
carrying amount of an asset may not be fully recoverable. Impair-
ment losses are recognized when the fair value is less than the
asset’s carrying value. When indicators of impairment are pre-
sent, the carrying values of the assets are evaluated in relation to
the operating performance and future undiscounted cash flows
of the underlying business. The net book value of the underlying
assets is adjusted to fair value if the sum of expected future
undiscounted cash flows is less than book value. Fair values are
based on quoted market prices and assumptions concerning the
amount and timing of estimated future cash flows and assumed
discount rates, reflecting varying degrees of perceived risk.
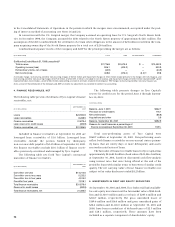
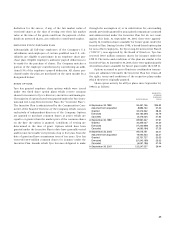
15. OTHER INCOME
Other income of Tyco Capital was $335.1 million for the period
from June 2 through September 30, 2001, as set forth in the fol-
lowing table:
($ IN MILLIONS)
Fees and other income $212.3
Gains on securitizations 59.0
Factoring commissions 50.7
Gains on sales of leasing equipment 14.2
Losses on venture capital investments (1.1)
Total $335.1
Included in fees and other income are miscellaneous fees,
syndication fees and gains from receivable sales.