ADT 2001 Annual Report Download - page 79
Download and view the complete annual report
Please find page 79 of the 2001 ADT annual report below. You can navigate through the pages in the report by either clicking on the pages listed below, or by using the keyword search tool below to find specific information within the annual report.-
 1
1 -
2
-
3
-
4
-
5
-
6
-
7
-
8
-
9
-
10
-
11
-
12
-
13
-
14
-
15
-
16
-
17
-
18
-
19
-
20
-
21
-
22
-
23
-
24
-
25
-
26
-
27
-
28
-
29
-
30
-
31
-
32
-
33
-
34
-
35
-
36
-
37
-
38
-
39
-
40
-
41
-
42
-
43
-
44
-
45
-
46
-
47
-
48
-
49
-
50
-
51
-
52
-
53
-
54
-
55
-
56
-
57
-
58
-
59
-
60
-
61
-
62
-
63
-
64
-
65
-
66
-
67
-
68
-
 69
69 -
 70
70 -
 71
71 -
 72
72 -
 73
73 -
 74
74 -
 75
75 -
 76
76 -
 77
77 -
 78
78 -
 79
79 -
 80
80 -
 81
81 -
 82
82 -
 83
83 -
 84
84 -
 85
85 -
 86
86 -
 87
87 -
 88
88 -
 89
89 -
90
-
91
-
92
-
93
-
94
 |
 |

77
(10) Includes merger, restructuring and other non-recurring charges of $643.3 million, of
which $106.4 million is included in cost of revenue, and charges for the impairment of long-
lived assets of $431.5 million related primarily to the merger with AMP and AMP’s profit
improvement plan.
(11) Includes a credit of $27.2 million representing a revision of estimates related to the
Company’s 1997 restructuring and other non-recurring accruals.
(12) Includes merger, restructuring and other non-recurring charges of $423.8 million and
charges for the impairment of long-lived assets of $76.0 million, related primarily to the
merger with U.S. Surgical, and a credit of $4.7 million representing a revision of estimates
related to the Company’s 1997 restructuring and other non-recurring accruals.
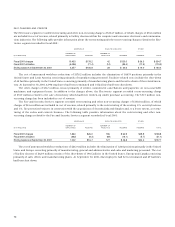
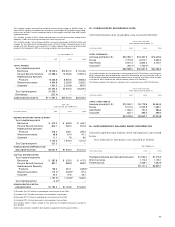
AT SEPTEMBER 30,
($ IN MILLIONS) 2001 2000 1999
TOTAL ASSETS:
Tyco Industrial segments
Electronics $ 18,259.4 $13,941.2 $ 9,413.6
Fire and Security Services 20,388.4 13,353.8 10,991.3
Healthcare and Specialty
Products 15,238.8 8,925.6 8,696.2
Telecommunications 4,946.8 2,029.9 2,392.2
Corporate 1,591.2 2,153.8 851.0
60,424.6 40,404.3 32,344.3
Tyco Capital segment 51,090.1
——
Eliminations (227.4)
——
CONSOLIDATED ASSETS $111,287.3 $40,404.3 $32,344.3
FOR THE
YEAR ENDED SEPTEMBER 30,
($ IN MILLIONS) 2001 2000 1999
DEPRECIATION AND AMORTIZATION:
Tyco Industrial segments
Electronics $ 670.0 $ 609.9 $ 446.7
Fire and Security Services 842.7 629.4 521.8
Healthcare and Specialty
Products 518.0 330.1 287.6
Telecommunications 98.8 67.4 47.1
Corporate 11.1 7.6 8.0
2,140.6 1,644.4 1,311.2
Tyco Capital segment 521.3
——
CONSOLIDATED DEPRECIATION
AND AMORTIZATION $2,661.9 $1,644.4 $1,311.2
CAPITAL EXPENDITURES:
Tyco Industrial segments
Electronics $ 587.8 $ 333.3 $ 417.3
Fire and Security Services 897.1 866.9 855.2
Healthcare and Specialty
Products 159.6 251.1 235.9(5)
Telecommunications 113.0(1) 204.9(3) 97.4
Corporate 40.0 47.6 26.7
1,797.5(2) 1,703.8(4) 1,632.5
Tyco Capital segment (3.2)(6)
——
CONSOLIDATED CAPITAL
EXPENDITURES $1,794.3 $1,703.8 $1,632.5
(1) Excludes $2,247.7 million in spending for construction of the TGN.
(2) Includes $427.7 million received in sale-leaseback transactions.
(3) Excludes $111.1 million in spending for construction of the TGN.
(4) Includes $172.0 million received in sale-leaseback transactions.
(5) Excludes $234.0 million related to the purchase of property previously leased by
U.S. Surgical.
(6) Excludes amounts related to Tyco Capital’s equipment to be leased to others.
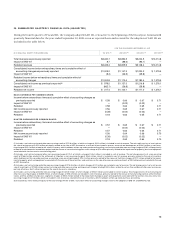
25. CONSOLIDATED GEOGRAPHIC DATA
Selected information by geographic area is presented below.
AS AT AND FOR THE
YEAR ENDED SEPTEMBER 30,
($ IN MILLIONS) 2001 2000 1999
TOTAL REVENUES:
Americas (primarily U.S.) $23,786.7 $18,457.5 $14,409.0
Europe 7,719.8 6,610.1 5,362.4
Asia
-
Pacific 4,541.3 3,864.3 2,725.1
Corporate(1) 340.7(1) 1,760.0(2)
—
$36,388.5 $30,691.9 $22,496.5
(1) Includes net gain on sale of business and investments of $276.6 million, consisting of a
$406.5 net gain primarily related to the sale of ADT Automotive, partially offset by a loss of
$129.9 million related to the permanent impairment of an equity investment. Also includes
a net gain of $64.1 million on the sale of common shares of a subsidiary.
(2) Includes a gain on the sale by a subsidiary of its common shares of $1,760.0 million.
AS AT AND FOR THE
YEAR ENDED SEPTEMBER 30,
($ IN MILLIONS) 2001 2000 1999
LONG-LIVED ASSETS:
Americas (primarily U.S.) $13,345.1 $5,779.8 $4,964.4
Europe 5,127.6 2,035.9 1,685.1
Asia
-
Pacific 1,186.0 751.5 986.3
Corporate 620.1 395.5 289.0
$20,278.8 $8,962.7 $7,924.8
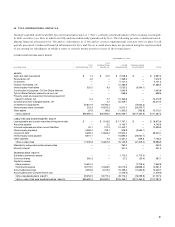
26. SUPPLEMENTARY BALANCE SHEET INFORMATION
Selected supplementary balance sheet information is presented
below.
Tyco Industrial’s inventories are classified as follows:
SEPTEMBER 30,
($ IN MILLIONS) 2001 2000
Purchased materials and manufactured parts $1,552.0 $1,076.5
Work in process 1,110.2 1,105.1
Finished goods 2,439.1 1,663.5
$5,101.3 $3,845.1