ADT 2001 Annual Report Download - page 78
Download and view the complete annual report
Please find page 78 of the 2001 ADT annual report below. You can navigate through the pages in the report by either clicking on the pages listed below, or by using the keyword search tool below to find specific information within the annual report.-
 1
1 -
2
-
3
-
4
-
5
-
6
-
7
-
8
-
9
-
10
-
11
-
12
-
13
-
14
-
15
-
16
-
17
-
18
-
19
-
20
-
21
-
22
-
23
-
24
-
25
-
26
-
27
-
28
-
29
-
30
-
31
-
32
-
33
-
34
-
35
-
36
-
37
-
38
-
39
-
40
-
41
-
42
-
43
-
44
-
45
-
46
-
47
-
48
-
49
-
50
-
51
-
52
-
53
-
54
-
55
-
56
-
57
-
58
-
59
-
60
-
61
-
62
-
63
-
64
-
65
-
66
-
67
-
 68
68 -
 69
69 -
 70
70 -
 71
71 -
 72
72 -
 73
73 -
 74
74 -
 75
75 -
 76
76 -
 77
77 -
 78
78 -
 79
79 -
 80
80 -
 81
81 -
 82
82 -
 83
83 -
 84
84 -
 85
85 -
 86
86 -
 87
87 -
 88
88 -
89
-
90
-
91
-
92
-
93
-
94
 |
 |

76
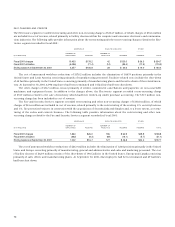
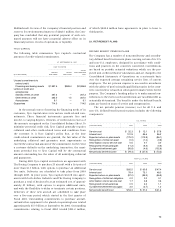
24. CONSOLIDATED SEGMENT DATA
The Company’s reportable segments are strategic business units
that operate in different industries and are managed separately.
Segment data have been presented on a basis consistent with
how business activities were reported internally to management
through the period covered by this report. Certain corporate
expenses were allocated to each operating segment’s operating
income, based generally on net revenues and other factors. For
additional information, including a description of the products
and services included in each segment, see Note 1.
During Fiscal 2001, a change was made to the Company’s
internal reporting structure such that the operations of the for-
mer Flow Control Products and Services segment are now
reported in part within the Fire and Security Services and in part
within the Electronics segments. The Company has conformed
its segment reporting accordingly and has reclassified compara-
tive prior period information to reflect this change.
On June 1, 2001, the Company acquired CIT, now Tyco
Capital Corporation. Tyco Capital’s operating activities include
vendor, equipment, commercial, factoring, consumer, and struc-
tured financing and leasing, and its results of operations are
included from June 2, 2001.
Selected information for the Company’s four manufactur-
ing and service segments and the Tyco Capital segment is pre-
sented in the following tables. While our Telecommunications
business currently operates as part of our Electronics segment,
it is presented separately in the segment data below. The seg-
ment profit measure for Tyco Industrial’s businesses is operat-
ing profit (earnings before interest, corporate expenses,
goodwill amortization and income taxes). The segment profit
measure for Tyco Capital is earnings before goodwill amortiza-
tion and income taxes.
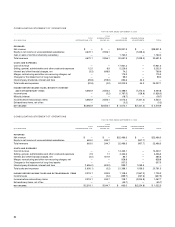
FOR THE
YEAR ENDED SEPTEMBER 30,
($ IN MILLIONS) 2001 2000 1999
REVENUES:
Tyco Industrial segments
Electronics $13,107.5(1) $11,417.7 $ 7,043.5
Fire and Security Services 10,253.2(2) 8,506.6 8,086.5
Healthcare and
Specialty Products 8,812.7(3) 6,467.9 5,742.7
Telecommunications 1,863.2 2,539.7 1,623.8
Tyco Capital segment 2,011.6
——
Corporate items 340.7(4) 1,760.0(5)
—
Eliminations (0.4)
——
CONSOLIDATED REVENUES $36,388.5 $30,691.9 $22,496.5
(1) Includes an increase of $55.4 million relating to the adoption of SAB 101.
(2) Includes a decrease of $275.9 million relating to the adoption of SAB 101.
(3) Includes a decrease of $20.6 million relating to the adoption of SAB 101.
(4) Consists of a net gain on sale of businesses and investments of $276.6 million, which
includes a $406.5 million net gain related primarily to the sale of ADT Automotive, partially
offset by a loss of $129.9 million related to the permanent impairment of an equity invest-
ment. Also includes a net gain of $64.1 million on the sale of common shares of a subsidiary.
(5) Consists of gain on the sale by a subsidiary of its common shares.
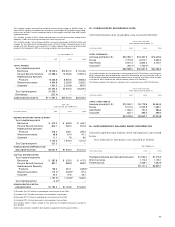
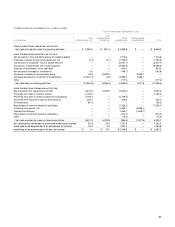
FOR THE
YEAR ENDED SEPTEMBER 30,
($ IN MILLIONS) 2001 2000 1999
SEGMENT PROFIT:
Tyco Industrial segments
Electronics $2,848.4(1) $2,850.8(5) $ (22.3)(10)
Fire and Security Services 1,690.6(2) 1,475.2(6) 1,336.1(11)
Healthcare and Specialty
Products 1,804.4(3) 1,439.8(7) 890.9(12)
Telecommunications 414.6 516.6(8) 325.1
Total Tyco Industrial
operating profit 6,758.0 6,282.4 2,529.8
Tyco Capital segment earnings
before income taxes 505.6
——
Total segment profits 7,263.6 6,282.4 2,529.8
Corporate expenses 312.2(4) 1,296.4(9) (122.9)
Goodwill amortization expense (597.2) (344.4) (216.1)
Tyco Industrial interest
expense, net (776.5) (769.6) (485.6)
Consolidated provision for
income taxes (1,479.9) (1,926.0) (637.5)
Consolidated minority interest (51.1) (18.7)
—
CONSOLIDATED INCOME BEFORE
EXTRAORDINARY ITEMS AND
CUMULATIVE EFFECT OF
ACCOUNTING CHANGES $4,671.1 $4,520.1 $1,067.7
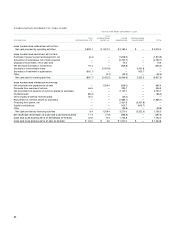
(1) Includes restructuring and other non-recurring charges of $334.7 million, of which
charges of $74.6 million are included in cost of revenue, primarily related to the closure of
facilities within the computer and consumer electronics and communications industries,
and a non-recurring charge of $51.7 million related to the sale of inventory which had been
written-up under purchase accounting, which is included in cost of revenue. Also includes
a charge of $98.6 million related to the impairment of property, plant and equipment asso-
ciated with the closure of these facilities and an increase of $22.5 million relating to the
adoption of SAB 101.
(2) Includes a restructuring and other non-recurring charge of $138.8 million, of which
$14.6 million is included in cost of revenue, related primarily to the closure of manufactur-
ing plants, warehouses, sales offices and administrative offices. Also includes a charge of
$6.1 million related primarily to the impairment of property, plant and equipment associated
with the closure of these facilities and a decrease of $183.8 million relating to the adoption
of SAB 101.
(3) Includes the write-off of purchased in-process research and development of $184.3 mil-
lion, a non-recurring charge of $35.0 million related to the sale of inventory which had been
written-up under purchase accounting, and restructuring and other non-recurring charges
of $21.7 million, of which $9.0 million is included in cost of revenue, related to the closure
of several manufacturing plants. Also includes a charge of $15.4 million related primarily to
the impairment of property, plant and equipment associated with the closure of these
plants and a decrease of $9.8 million relating to the adoption of SAB 101.
(4) Includes a net gain on sale of businesses and investments of $276.6 million, consisting
of a $406.5 million net gain related primarily to the sale of ADT Automotive, partially offset
by a loss of $129.9 million related to the permanent impairment of an equity investment.
Also includes a net gain of $64.1 million on the sale of a subsidiary’s common shares, a non-
recurring credit of $166.8 million related to the settlement of litigation and a non-recurring
charge of $3.4 million related to severance.
(5) Includes a restructuring charge of $16.9 million, of which $0.9 million is included in cost
of revenue, related to AMP’s Brazilian operations and wireless communications business
and a credit of $107.8 million, of which $6.3 million is included in cost of revenue, repre-
senting primarily a revision of estimates of merger, restructuring and other non-recurring
accruals related to the merger with AMP and AMP’s profit improvement plan.
(6) Includes a merger, restructuring and other non-recurring credit of $11.2 million repre-
senting a revision in estimates related to the Company’s 1997 restructuring accruals.
(7) Includes charges for the impairment of long-lived assets of $99.0 million and restruc-
turing and other non-recurring charges of $7.9 million, of which $6.4 million is included in
cost of revenue, related to exiting U.S. Surgical’s interventional cardiology business.
Includes restructuring and other non-recurring charges of $11.1 million related to U.S. Sur-
gical’s suture business. Also includes a credit of $29.9 million representing a revision in esti-
mates of merger, restructuring and other non-recurring accruals consisting of $19.7 million
related primarily to the merger with U.S. Surgical and $10.2 million related to the Company’s
1997 restructuring accruals.
(8) Includes a non-recurring charge of $13.1 million incurred in connection with the TyCom IPO.
(9) Includes a non-recurring gain on the sale by a subsidiary of its common shares of
$1,760.0 million. Also includes charges of $275.0 million as a reserve for certain claims
relating to a merged company in the Healthcare business and other non-recurring charges
of $1.2 million.