ADT 2001 Annual Report Download - page 61
Download and view the complete annual report
Please find page 61 of the 2001 ADT annual report below. You can navigate through the pages in the report by either clicking on the pages listed below, or by using the keyword search tool below to find specific information within the annual report.-
 1
1 -
2
-
3
-
4
-
5
-
6
-
7
-
8
-
9
-
10
-
11
-
12
-
13
-
14
-
15
-
16
-
17
-
18
-
19
-
20
-
21
-
22
-
23
-
24
-
25
-
26
-
27
-
28
-
29
-
30
-
31
-
32
-
33
-
34
-
35
-
36
-
37
-
38
-
39
-
40
-
41
-
42
-
43
-
44
-
45
-
46
-
47
-
48
-
49
-
50
-
 51
51 -
 52
52 -
 53
53 -
 54
54 -
 55
55 -
 56
56 -
 57
57 -
 58
58 -
 59
59 -
 60
60 -
 61
61 -
 62
62 -
 63
63 -
 64
64 -
 65
65 -
 66
66 -
 67
67 -
 68
68 -
 69
69 -
 70
70 -
 71
71 -
72
-
73
-
74
-
75
-
76
-
77
-
78
-
79
-
80
-
81
-
82
-
83
-
84
-
85
-
86
-
87
-
88
-
89
-
90
-
91
-
92
-
93
-
94
 |
 |

59
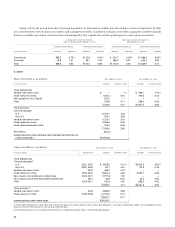
At September 30, 2001, Tyco Capital’s investments in debt
and equity securities designated as available-for-sale totaled
$972.6 million and have been included in other assets on the
Consolidated Balance Sheet.
Included in Tyco Capital’s investments in debt and equity
securities are retained interests in commercial securitized assets of
$843.6 million and consumer securitized assets of $126.5 million
at September 30, 2001. Retained interests include interest-only
strips, retained subordinated securities, and cash reserve accounts
related to securitizations. The carrying value of the retained inter-
ests in securitized assets is reviewed at least quarterly for valua-
tion impairment.
The securitization programs cover a wide range of products
and collateral types with significantly different prepayment and
credit risk characteristics.
The prepayment speed, in the tables below, is based on Con-
stant Prepayment Rate (“CPR”), which expresses payments as a
function of the declining amount of loans at a compound annual
rate. Expected credit losses are based upon annual loss rates.
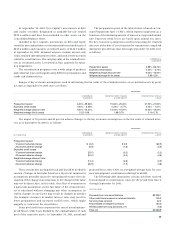
The key economic assumptions used in measuring the retained
interests at the date of securitization for transactions completed
during the period from June 2 through September 30, 2001 were
as follows:
COMMERCIAL
EQUIPMENT
Prepayment speed 6.98%–56.74%
Expected credit losses 0.00%– 6.14%
Weighted average discount rate 9.00%–16.00%
Weighted average life (in years) 0.90–2.50
Ranges of key economic assumptions used in calculating the fair value of the retained interests in securitized assets by prod-
uct type at September 30, 2001 were as follows:
CONSUMER
COMMERCIAL MANUFACTURED HOUSING RECREATIONAL VEHICLE
EQUIPMENT & HOME EQUITY & BOAT
Prepayment speed 6.00%–59.38% 15.60% –25.40% 21.50%–21.50%
Expected credit losses 0.00%– 8.08% 0.24%– 2.77% 0.00% – 1.51%
Weighted average discount rate 9.00%–16.00% 13.00%–15.00% 14.00%–15.00%
Weighted average life (in years) 0.22–1.98 1.88–3.79 0.16–2.76
The impact of 10 percent and 20 percent adverse changes to the key economic assumptions on the fair value of retained inter-
ests as of September 30, 2001 is as follows:
CONSUMER
COMMERCIAL MANUFACTURED HOUSING RECREATIONAL VEHICLE
($ IN MILLIONS) EQUIPMENT & HOME EQUITY & BOAT
Prepayment speed:
10 percent adverse change $ (3.2) $ 0.9 $(2.5)
20 percent adverse change (5.8) (1.8) (4.9)
Expected credit losses:
10 percent adverse change (25.0) (0.2) (2.2)
20 percent adverse change (50.0) (0.4) (4.5)
Weighted average discount rate:
10 percent adverse change (13.4) (0.8) (2.5)
20 percent adverse change (26.5) (1.5) (4.8)
projected losses were 1.92% on a weighted-average basis for com-
mercial equipment securitizations during Fiscal 2001.
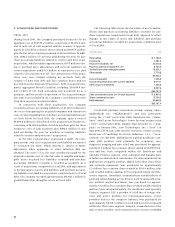
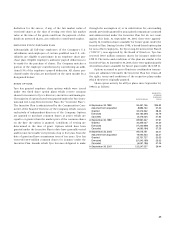
The following table summarizes certain cash flows received
from and paid to securitization trusts for the period from June 2
through September 30, 2001:
($ IN MILLIONS)
Proceeds from new securitizations $2,229.1
Other cash flows received on retained interests 105.2
Servicing fees received 22.2
Repurchases of ineligible contracts (83.4)
Reimbursable servicing advances, net (4.2)
Total, net $2,268.9
These sensitivities are hypothetical and should be used with
caution. Changes in fair value based on a 10 percent variation in
assumptions generally cannot be extrapolated because the rela-
tionship of the change in assumptions to the change in fair value
may not be linear. Also, in this table, the effect of a variation in
a particular assumption on the fair value of the retained inter-
est is calculated without changing any other assumption. In
reality, changes in one factor may result in changes in another
(for example, increases in market interest rates may result in
lower prepayments and increased credit losses), which might
magnify or counteract the sensitivities.
Static pool credit losses represent the sum of actual and pro-
jected future credit losses divided by the original balance of each
pool of the respective assets. At September 30, 2001, actual and