ADT 2001 Annual Report Download - page 27
Download and view the complete annual report
Please find page 27 of the 2001 ADT annual report below. You can navigate through the pages in the report by either clicking on the pages listed below, or by using the keyword search tool below to find specific information within the annual report.-
 1
1 -
2
-
3
-
4
-
5
-
6
-
7
-
8
-
9
-
10
-
11
-
12
-
13
-
14
-
15
-
16
-
 17
17 -
 18
18 -
 19
19 -
 20
20 -
 21
21 -
 22
22 -
 23
23 -
 24
24 -
 25
25 -
 26
26 -
 27
27 -
 28
28 -
 29
29 -
 30
30 -
 31
31 -
 32
32 -
 33
33 -
 34
34 -
 35
35 -
 36
36 -
 37
37 -
38
-
39
-
40
-
41
-
42
-
43
-
44
-
45
-
46
-
47
-
48
-
49
-
50
-
51
-
52
-
53
-
54
-
55
-
56
-
57
-
58
-
59
-
60
-
61
-
62
-
63
-
64
-
65
-
66
-
67
-
68
-
69
-
70
-
71
-
72
-
73
-
74
-
75
-
76
-
77
-
78
-
79
-
80
-
81
-
82
-
83
-
84
-
85
-
86
-
87
-
88
-
89
-
90
-
91
-
92
-
93
-
94
 |
 |

25
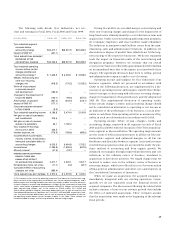
The following table details Tyco Industrial’s net rev-
enue and earnings in Fiscal 2001, Fiscal 2000 and Fiscal 1999:
($ IN MILLIONS) FISCAL 2001 FISCAL 2000 FISCAL 1999
Tyco Industrial segment
revenues before
accounting change $34,277.7 $28,931.9 $22,496.5
Impact of SAB 101 (241.1)
——
TYCO INDUSTRIAL SEGMENT
REVENUES AFTER
ACCOUNTING CHANGE $34,036.6 $28,931.9 $22,496.5
Tyco Industrial operating
income, before certain
charges (credits) and
accounting change(1) $ 7,623.5 $ 6,094.1 $ 3,949.6
Merger, restructuring and
other non-recurring
charges, net (418.5) (176.3) (1,035.2)
Write-off of purchased
in-process research
and development (184.3)
——
Charges for the impairment of
long-lived assets (120.1) (99.0) (507.5)
Amortization of goodwill (537.4) (344.4) (216.1)
Impact of SAB 101 (171.1)
——
Corporate expense allocated
to Tyco Capital (5.3)
——
Tyco Industrial operating income 6,186.8 5,474.4 2,190.8
Net gain on sale of businesses
and investments 276.6
——
Net gain on sale of common
shares of a subsidiary 64.1 1,760.0
—
Tyco Capital net earnings
(from June 2, 2001) 252.5
——
Interest expense, net (776.5) (769.6) (485.6)
Income before income taxes,
minority interest, extraordinary
items and cumulative effect of
accounting changes 6,003.5 6,464.8 1,705.2
Income taxes (1,284.9) (1,926.0) (637.5)
Minority interest (47.5) (18.7)
—
INCOME BEFORE EXTRAOR-
DINARY ITEMS AND
CUMULATIVE EFFECT
OF ACCOUNTING CHANGES 4,671.1 4,520.1 1,067.7
Extraordinary items, net of tax (17.1) (0.2) (45.7)
Cumulative effect of accounting
changes, net of tax (683.4)
——
TYCO INDUSTRIAL NET INCOME $ 3,970.6 $ 4,519.9 $ 1,022.0
(1) This amount is the sum of the operating income of Tyco Industrial’s four business seg-
ments set forth in the segment discussion below, less certain corporate expenses, and is
before merger, restructuring and other non-recurring charges (credits), the write-off of pur-
chased in-process research and development, charges for the impairment of long-lived
assets, amortization of goodwill and the adoption of SAB 101. Merger, restructuring and
other non-recurring charges, net, in the amount of $184.9 million, $1.0 million and
$106.4 million related to inventory have been deducted as part of cost of revenue in the
Consolidated Statements of Operations for Fiscal 2001, 2000 and 1999, respectively. How-
ever, they have not been deducted as part of cost of revenue for the purpose of calculat-
ing operating income before certain charges (credits) in this table. These charges are
instead included in merger, restructuring and other non-recurring charges.
During Fiscal 2001, we recorded merger, restructuring and
other non-recurring charges and charges for the impairment of
long-lived assets related primarily to cost reduction actions and
acquisitions. Under our restructuring and integration programs,
we terminate employees and close facilities made redundant.
The reduction in manpower and facilities comes from the man-
ufacturing, sales and administrative functions. In addition, we
discontinue or dispose of product lines which do not fit the long-
term strategy of the respective businesses. We do not separately
track the impact on financial results of the restructuring and
integration programs. However, we estimate that our overall
cost structure has been reduced by approximately $300.0 million
on an annualized basis due to the impact associated with these
charges. The significant decreases have been to selling, general
and administrative expenses and to cost of revenue.
Operating income and margins for Tyco Industrial’s four
business segments, which are presented in accordance with
GAAP in the following discussion, are supplemented by a dis-
cussion of operating income and margins stated before deduc-
tions for merger, restructuring and other non-recurring charges,
charges for impairment of long-lived assets and the adoption of
SAB 101. This supplemental discussion of operating results
before certain charges (credits) and accounting change should
not be considered an alternative to operating or net income as
an indicator of the performance of our business, or as an alter-
native to cash flows from operating activities as a measure of liq-
uidity, in each case determined in accordance with GAAP.
Operating income, before certain (charges) credits and
accounting change, improved in all segments in each of Fiscal
2001 and Fiscal 2000, with the exception of the Telecommunica-
tions segment as discussed below. The operating improvements
are the result of both increased revenues in all but our Telecom-
munications segment and enhanced margins in all but our
Healthcare and Specialty Products segment. Increased revenues
resulted from acquisitions that are accounted for under the pur-
chase method of accounting and from organic growth. We
enhanced our margins through improved productivity and cost
reductions in the ordinary course of business, unrelated to
acquisition or divestiture activities. We regard charges that we
incurred to reduce costs in the ordinary course of business as
recurring charges, which are reflected in cost of revenue and in
selling, general, administrative and other costs and expenses in
the Consolidated Statements of Operations.
When we make an acquisition, the acquired company is
immediately integrated with our existing operations. Conse-
quently, we do not separately track the financial results of
acquired companies. The discussions following the tables below
include estimates of year-to-year revenue growth that exclude
the effects of indicated acquisitions. These estimates assume
that the acquisitions were made at the beginning of the relevant
fiscal periods.