ADT 2001 Annual Report Download - page 60
Download and view the complete annual report
Please find page 60 of the 2001 ADT annual report below. You can navigate through the pages in the report by either clicking on the pages listed below, or by using the keyword search tool below to find specific information within the annual report.-
 1
1 -
2
-
3
-
4
-
5
-
6
-
7
-
8
-
9
-
10
-
11
-
12
-
13
-
14
-
15
-
16
-
17
-
18
-
19
-
20
-
21
-
22
-
23
-
24
-
25
-
26
-
27
-
28
-
29
-
30
-
31
-
32
-
33
-
34
-
35
-
36
-
37
-
38
-
39
-
40
-
41
-
42
-
43
-
44
-
45
-
46
-
47
-
48
-
49
-
 50
50 -
 51
51 -
 52
52 -
 53
53 -
 54
54 -
 55
55 -
 56
56 -
 57
57 -
 58
58 -
 59
59 -
 60
60 -
 61
61 -
 62
62 -
 63
63 -
 64
64 -
 65
65 -
 66
66 -
 67
67 -
 68
68 -
 69
69 -
 70
70 -
71
-
72
-
73
-
74
-
75
-
76
-
77
-
78
-
79
-
80
-
81
-
82
-
83
-
84
-
85
-
86
-
87
-
88
-
89
-
90
-
91
-
92
-
93
-
94
 |
 |

58
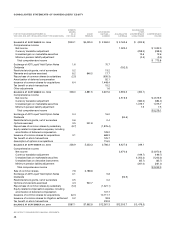
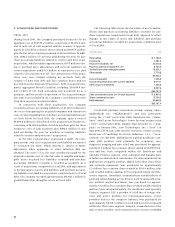
in the Consolidated Statements of Operations in the periods in which the mergers were consummated, as required under the pool-
ing of interests method of accounting (see Notes 16 and 21).
In connection with the U.S. Surgical merger, the Company assumed an operating lease for U.S. Surgical’s North Haven facili-
ties. In December 1998, the Company assumed the debt related to the North Haven property of approximately $211 million. The
assumption of the debt combined with the settlement of certain other obligations in the amount of $23 million resulted in the Com-
pany acquiring ownership of the North Haven property for a total cost of $234 million.
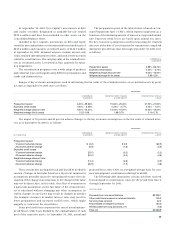
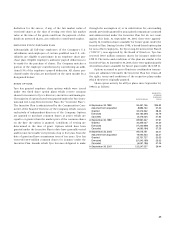
Combined and separate results of the Company and AMP for the period preceding the merger are as follows:
($ IN MILLIONS) TYCO AMP ADJUSTMENTS COMBINED
Six Months Ended March 31, 1999 (unaudited)(1)
Total revenue $7,776.8 $2,675.5 $
—
$10,452.3
Operating income (loss) 906.1 (405.2)
—
500.9
Extraordinary items, net of taxes (44.9)
——
(44.9)
Net income (loss) 408.8 (376.0) (3.0)(2) 29.8
(1) Includes merger, restructuring and other non-recurring charges of $414.6 million and impairment charges of $76.0 million related primarily to the merger with U.S. Surgical, and
restructuring and other non-recurring charges of $275.3 million, of which $55.2 million is included in cost of revenue, and impairment charges of $236.7 million related to AMP’s profit
improvement plan. Also includes a credit of $8.3 million representing a revision of estimates related to the Company’s 1997 merger, restructuring and other non-recurring accruals.
(2) As a result of the combination of the Company and AMP, an income tax adjustment was recorded to conform tax accounting.
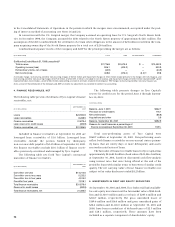
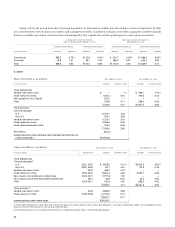
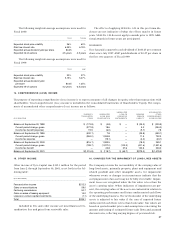
4. FINANCE RECEIVABLES, NET
The following table presents the details of Tyco Capital’s finance
receivables, net:
SEPTEMBER 30,
($ IN MILLIONS) 2001
Loans $23,590.9
Lease receivables 8,288.5
Finance receivables 31,879.4
Less: reserve for credit losses (492.9)
Finance receivables, net $31,386.5
Included in finance receivables at September 30, 2001 are
leveraged lease receivables of $1.0 billion. Leveraged lease
receivables exclude the portion funded by third-party,
non-recourse debt payable of $2.4 billion at September 30, 2001.
Net finance receivables exclude $10.1 billion of finance receiv-
ables previously securitized and managed by Tyco Capital.
The following table sets forth Tyco Capital’s contractual
maturities of finance receivables.
SEPTEMBER 30,
($ IN MILLIONS) 2001
Due within one year $14,212.6
Due within one to two years 5,233.5
Due within two to four years 4,515.2
Due after four years 7,918.1
Total finance receivables $31,879.4
Reserve for credit losses (492.9)
Total finance receivables, net 31,386.5
The following table presents changes in Tyco Capital’s
reserve for credit losses for the period June 2 through Septem-
ber 30, 2001:
($ IN MILLIONS)
Balance, June 1, 2001 $462.7
Provision for credit losses 116.1
Net credit losses (86.8)
Acquisitions and other 0.9
Balance, September 30, 2001 $492.9
Reserve for credit losses as a percentage of
finance receivables at September 30, 2001 1.55%
Total non-performing assets of Tyco Capital were
$969.7 million at September 30, 2001. Non-performing assets
reflect both finance receivables on non-accrual status (primar-
ily loans that are ninety days or more delinquent) and assets
received in satisfaction of loans.
The fair value of finance receivable loans for Tyco Capital was
approximately $23,683.9 million (book value of $23,226.2 million)
at September 30, 2001, based on discounted cash flow analysis
using interest rates that were being offered at the end of the
period for loans with similar terms to borrowers of similar credit
quality. The net carrying value of lease finance receivables not
subject to fair value disclosure totaled $8.2 billion.
5. INVESTMENTS IN DEBT AND EQUITY SECURITIES
At September 30, 2001 and 2000, Tyco Industrial had available-
for-sale equity investments with a fair market value of $84.4 mil-
lion and $1,320.3 million and a cost basis of $205.6 million and
$218.7 million, respectively. The gross unrealized losses of
$149.6 million and $16.4 million and gross unrealized gains of
$28.4 million and $1,118.0 million at September 30, 2001 and
2000, have been recorded net of deferred taxes of $2.5 million
and $18.1 million, respectively. These amounts have been
included as a separate component of shareholders’ equity.