ADT 2001 Annual Report Download - page 32
Download and view the complete annual report
Please find page 32 of the 2001 ADT annual report below. You can navigate through the pages in the report by either clicking on the pages listed below, or by using the keyword search tool below to find specific information within the annual report.-
 1
1 -
2
-
3
-
4
-
5
-
6
-
7
-
8
-
9
-
10
-
11
-
12
-
13
-
14
-
15
-
16
-
17
-
18
-
19
-
20
-
21
-
 22
22 -
 23
23 -
 24
24 -
 25
25 -
 26
26 -
 27
27 -
 28
28 -
 29
29 -
 30
30 -
 31
31 -
 32
32 -
 33
33 -
 34
34 -
 35
35 -
 36
36 -
 37
37 -
 38
38 -
 39
39 -
 40
40 -
 41
41 -
 42
42 -
43
-
44
-
45
-
46
-
47
-
48
-
49
-
50
-
51
-
52
-
53
-
54
-
55
-
56
-
57
-
58
-
59
-
60
-
61
-
62
-
63
-
64
-
65
-
66
-
67
-
68
-
69
-
70
-
71
-
72
-
73
-
74
-
75
-
76
-
77
-
78
-
79
-
80
-
81
-
82
-
83
-
84
-
85
-
86
-
87
-
88
-
89
-
90
-
91
-
92
-
93
-
94
 |
 |

30
TYCO CAPITAL
On June 1, 2001, a subsidiary of Tyco acquired The CIT Group,
Inc., an independent commercial finance company, now Tyco
Capital Corporation. The discussion herein is only for the period
June 2 through September 30, 2001 (the “Four Month Period”).
The results for the Four Month Period are not indicative of
results which would have been achieved for an entire year. Tyco
Capital’s services include:
• commercial financing and leasing
—
offering equipment, com-
mercial factoring and structured financing; and
• specialty financing and leasing
—
consumer lending and retail
sales and vendor financing.
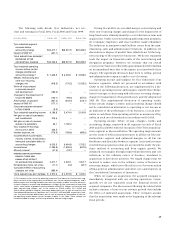
The following table sets forth operating results of Tyco
Capital:
FOR THE PERIOD
JUNE 2 THROUGH
($ IN MILLIONS) SEPTEMBER 30, 2001
Finance income $ 1,676.5
Interest expense 597.1
Net finance income 1,079.4
Depreciation on operating lease equipment (1) 448.6
Net finance margin 630.8
Other income 335.1
Operating revenue 965.9
Selling, general, administrative and other
costs and expenses less depreciation on
operating lease equipment (398.7)
Provision for credit losses (116.1)
Income before income taxes and minority interest $ 451.1
Average earning assets (“AEA”) (2) $39,159.2
Net finance margin as a percent of AEA (annualized) 4.83%
Operating revenue as a percent of AEA (annualized) 7.40%
(1) Depreciation on operating lease equipment has been included within selling, gen-
eral, administrative and other costs and expenses in the Consolidated Statements of
Operations.
(2) Average earning assets is the average of finance receivables, operating lease equip-
ment, finance receivables held for sale and certain investments, less credit balances of
factoring clients.
Tyco Capital’s revenues were $2,011.6 million for the Four
Month Period. Finance income totaled $1,676.5 million for the
Four Month Period. As a percentage of AEA, finance income
(excluding interest income related to short-term interest-
bearing deposits) was 12.70%.
Interest expense totaled $597.1 million for the Four Month
Period. As a percentage of AEA, interest expense (excluding
interest related to short-term interest-bearing deposits and div-
idends related to preferred capital securities) was 4.43%.
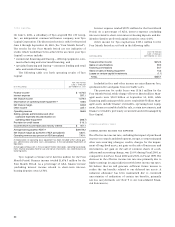
Other income for Tyco Capital was $335.1 million for the
Four Month Period as set forth in the following table:
FOR THE PERIOD
JUNE 2 THROUGH
($ IN MILLIONS) SEPTEMBER 30, 2001
Fees and other income $212.3
Gains on securitizations 59.0
Factoring commissions 50.7
Gains on sales of leasing equipment 14.2
Losses on venture capital investments (1.1)
TOTAL $335.1
Included in fees and other income are miscellaneous fees,
syndication fees and gains from receivable sales.
The provision for credit losses was $116.1 million for the
Four Month Period, while charge-offs were $86.8 million. Man-
aged assets were $50.9 billion at September 30, 2001, while
financing and leasing portfolio assets totaled $40.7 billion. Man-
aged assets include finance receivables, operating lease equip-
ment, finance receivables held for sale, certain investments, and
finance receivables previously securitized and still managed by
Tyco Capital.
CONSOLIDATED ITEMS
CONSOLIDATED INCOME TAX EXPENSE
The effective income tax rate, excluding the impact of purchased
in-process research and development, merger, restructuring and
other non-recurring (charges) credits, charges for the impair-
ment of long-lived assets, net gain on the sale of businesses and
investments, net gain on the sale of common shares of a sub-
sidiary and accounting change, was 23.0% during Fiscal 2001, as
compared to 24.8% in Fiscal 2000 and 27.0% in Fiscal 1999. The
decrease in the effective income tax rate was primarily due to
higher earnings in tax jurisdictions with lower income tax rates.
We believe that we will generate sufficient future income to
realize the tax benefits related to our deferred tax assets. A
valuation allowance has been maintained due to continued
uncertainties of realization of certain tax benefits, primarily
tax loss carryforwards (see Note 9 to our Consolidated Finan-
cial Statements).