Singapore Airlines 2003 Annual Report Download - page 69
Download and view the complete annual report
Please find page 69 of the 2003 Singapore Airlines annual report below. You can navigate through the pages in the report by either clicking on the pages listed below, or by using the keyword search tool below to find specific information within the annual report.-
 1
1 -
2
-
3
-
4
-
5
-
6
-
7
-
8
-
9
-
10
-
11
-
12
-
13
-
14
-
15
-
16
-
17
-
18
-
19
-
20
-
21
-
22
-
23
-
24
-
25
-
26
-
27
-
28
-
29
-
30
-
31
-
32
-
33
-
34
-
35
-
36
-
37
-
38
-
39
-
40
-
41
-
42
-
43
-
44
-
45
-
46
-
47
-
48
-
49
-
50
-
51
-
52
-
53
-
54
-
55
-
56
-
57
-
58
-
 59
59 -
 60
60 -
 61
61 -
 62
62 -
 63
63 -
 64
64 -
 65
65 -
 66
66 -
 67
67 -
 68
68 -
 69
69 -
 70
70 -
 71
71 -
 72
72 -
 73
73 -
 74
74 -
 75
75 -
 76
76 -
 77
77 -
 78
78 -
 79
79 -
80
-
81
-
82
-
83
-
84
-
85
-
86
-
87
-
88
-
89
-
90
-
91
-
92
-
93
-
94
-
95
-
96
-
97
-
98
-
99
-
100
-
101
-
102
-
103
-
104
-
105
-
106
-
107
-
108
-
109
-
110
-
111
-
112
-
113
-
114
-
115
-
116
-
117
-
118
-
119
-
120
-
121
-
122
-
123
-
124
-
125
-
126
-
127
-
128
 |
 |
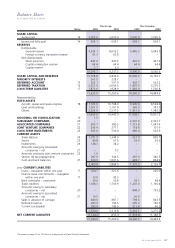
The Group The Company
Notes 2003 2002 2003 2002
SHARE CAPITAL
Authorized 14 3,000.0 3,000.0 3,000.0 3,000.0
Issued and fully paid 14 609.1 609.1 609.1 609.1
RESERVES
Distributable
General reserve 9,539.1 8,655.2 9,485.3 9,049.0
Foreign currency translation reserve 41.3 63.8 – –
Non-distributable
Share premium 447.2 447.2 447.2 447.2
Capital redemption reserve 64.4 64.4 64.4 64.4
Capital reserve 7.7 6.9 – –
10,099.7 9,237.5 9,996.9 9,560.6
SHARE CAPITAL AND RESERVES 10,708.8 9,846.6 10,606.0 10,169.7
MINORITY INTERESTS 267.5 228.7 – –
DEFERRED ACCOUNT 15 523.1 591.9 462.7 562.2
DEFERRED TAXATION 16 2,251.0 2,664.5 1,807.9 2,205.9
LONG-TERM LIABILITIES 17 1,879.6 1,928.9 1,483.9 1,506.8
15,630.0 15,260.6 14,360.5 14,444.6
Represented by:
FIXED ASSETS
Aircraft, spares and spare engines 18 11,723.6 10,798.3 9,345.6 8,538.2
Land and buildings 1,057.5 1,107.4 360.9 383.0
Others 2,624.9 2,537.2 1,951.6 1,980.0
15,406.0 14,442.9 11,658.1 10,901.2
GOODWILL ON CONSOLIDATION 19 1.5 – – –
SUBSIDIARY COMPANIES 20 – – 2,291.0 2,393.7
ASSOCIATED COMPANIES 21 500.7 385.5 1,721.8 1,687.4
JOINT VENTURE COMPANIES 22 296.4 277.1 118.8 107.9
LONG-TERM INVESTMENTS 23 569.6 590.4 489.4 502.9
CURRENT ASSETS
Trade debtors 24 1,071.9 1,344.9 651.9 895.7
Stocks 25 80.8 67.0 29.0 29.6
Investments 26 148.3 34.2 – –
Amounts owing by associated
companies – net 21 – 0.3 – –
Amounts owing by joint venture companies 22 1.0 – – –
Section 44 tax prepayments 287.9 346.5 287.9 346.5
Cash and bank balances 27 819.9 1,091.6 428.7 854.9
2,409.8 2,884.5 1,397.5 2,126.7
Less: CURRENT LIABILITIES
Loans – repayable within one year 17 224.7 221.6 – 220.0
Finance lease commitments – repayable
within one year 17 13.0 42.3 – –
Bank overdrafts – unsecured 30.6 56.8 29.1 48.4
Trade creditors 1,928.3 1,769.9 1,207.0 1,166.4
Amounts owing to subsidiary
companies – net 20 – – 844.3 759.2
Amounts owing to associated
companies – net 21 19.5 – 20.0 –
Sales in advance of carriage 849.6 887.7 798.6 824.5
Deferred revenue 205.3 196.5 205.3 196.5
Current tax payable 283.0 145.0 211.8 60.2
3,554.0 3,319.8 3,316.1 3,275.2
NET CURRENT LIABILITIES (1,144.2) (435.3) (1,918.6) (1,148.5)
15,630.0 15,260.6 14,360.5 14,444.6
67
SIA Annual Report 02/03
The notes on pages 72 to 107 form an integral part of these financial statements.
Balance Sheets
At 31 March 2003 (in $ million)