Singapore Airlines 2003 Annual Report Download - page 57
Download and view the complete annual report
Please find page 57 of the 2003 Singapore Airlines annual report below. You can navigate through the pages in the report by either clicking on the pages listed below, or by using the keyword search tool below to find specific information within the annual report.-
 1
1 -
2
-
3
-
4
-
5
-
6
-
7
-
8
-
9
-
10
-
11
-
12
-
13
-
14
-
15
-
16
-
17
-
18
-
19
-
20
-
21
-
22
-
23
-
24
-
25
-
26
-
27
-
28
-
29
-
30
-
31
-
32
-
33
-
34
-
35
-
36
-
37
-
38
-
39
-
40
-
41
-
42
-
43
-
44
-
45
-
46
-
 47
47 -
 48
48 -
 49
49 -
 50
50 -
 51
51 -
 52
52 -
 53
53 -
 54
54 -
 55
55 -
 56
56 -
 57
57 -
 58
58 -
 59
59 -
 60
60 -
 61
61 -
 62
62 -
 63
63 -
 64
64 -
 65
65 -
 66
66 -
 67
67 -
68
-
69
-
70
-
71
-
72
-
73
-
74
-
75
-
76
-
77
-
78
-
79
-
80
-
81
-
82
-
83
-
84
-
85
-
86
-
87
-
88
-
89
-
90
-
91
-
92
-
93
-
94
-
95
-
96
-
97
-
98
-
99
-
100
-
101
-
102
-
103
-
104
-
105
-
106
-
107
-
108
-
109
-
110
-
111
-
112
-
113
-
114
-
115
-
116
-
117
-
118
-
119
-
120
-
121
-
122
-
123
-
124
-
125
-
126
-
127
-
128
 |
 |
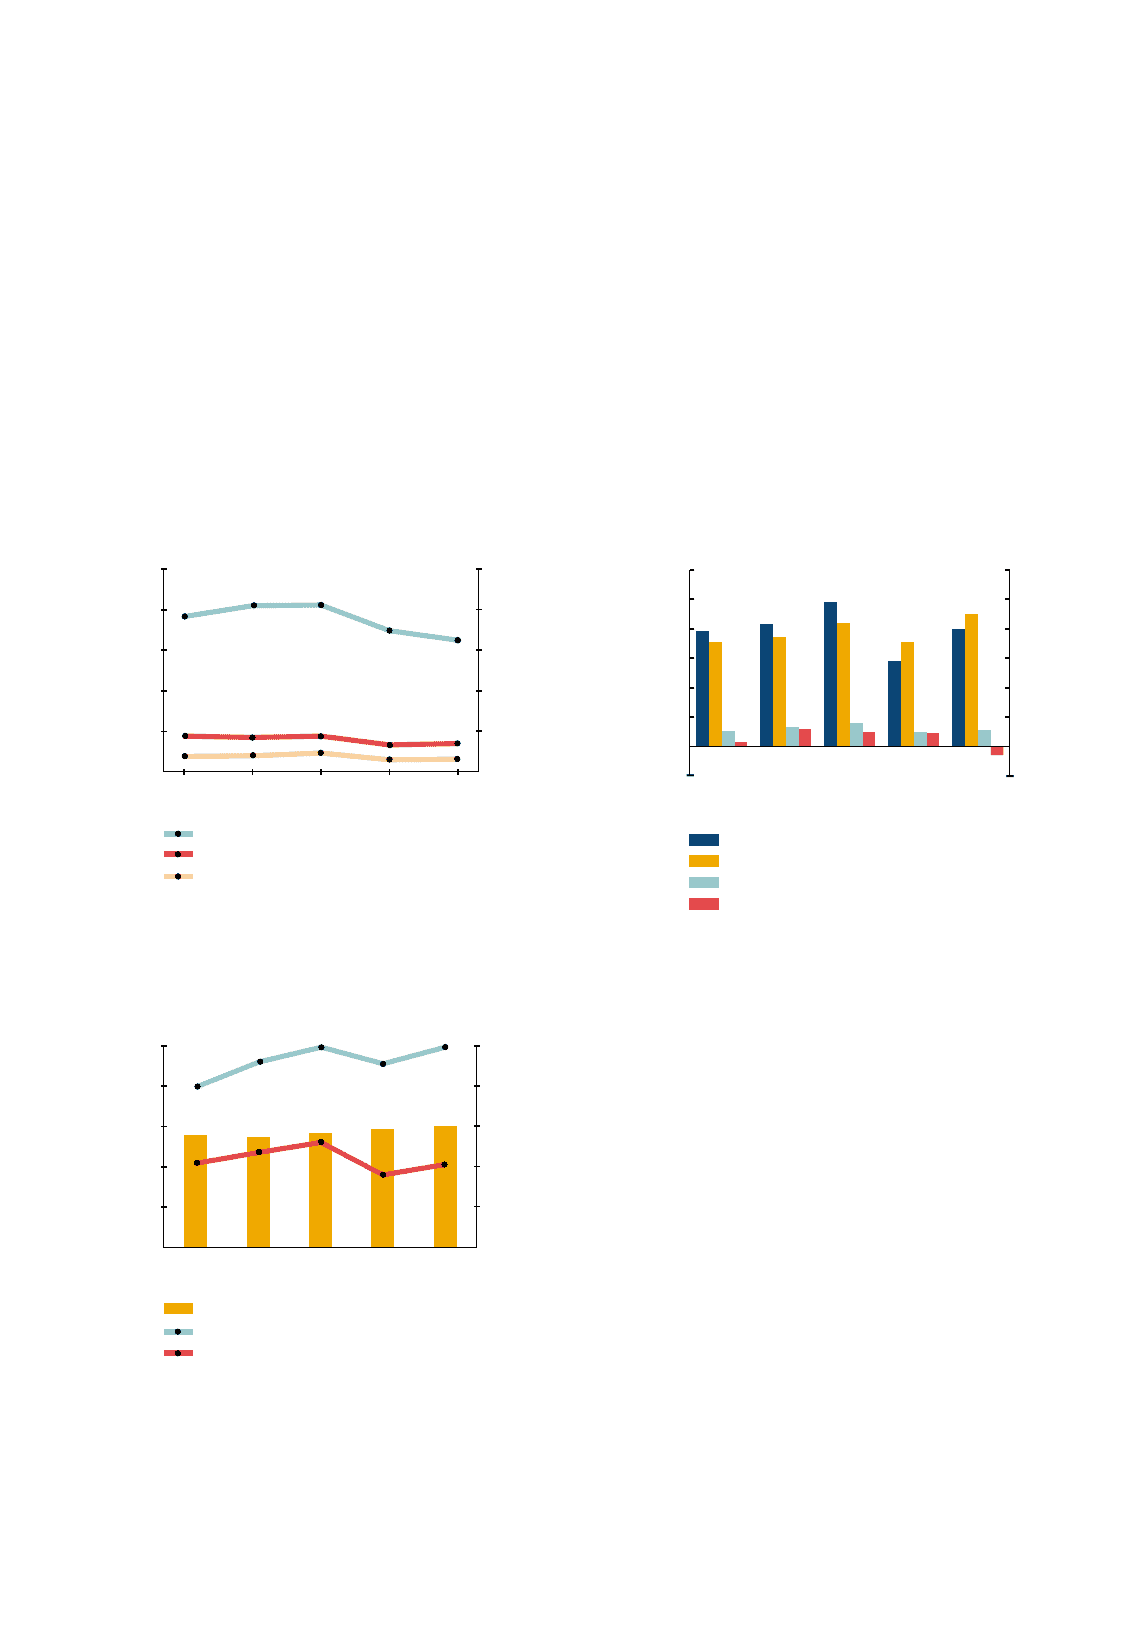
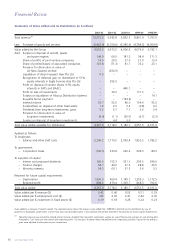
Value Added
Compared to 2001-02, the total value added of the Group increased by $649 million to $4,367 million in 2002-03.
This was mainly attributable to increase in revenue (+$1,132 million), provision for diminution in value of the
investment in Air New Zealand Limited in the previous year (+$267 million) and higher share of profits of associated
companies (+$195 million), partially offset by higher costs of goods and services purchased (-$753 million) and gain
on divestment of 51 per cent equity interests in Eagle Services Asia Pte Ltd in the previous year (-$203 million).
Salaries and other staff costs accounted for $2,245 million (51.4 per cent) of the value added. $167 million (3.8 per
cent) was applied on dividends for shareholders, and $55 million paid for finance charges (1.3 per cent). Minority
interests’ share was $55 million (1.2 per cent). The remaining $1,988 million (45.6 per cent) was retained for future
capital requirement. The above was partially offset by the write-back of corporate taxes, at $143 million (3.3 per cent).
55
SIA Annual Report 02/03
Financial Review
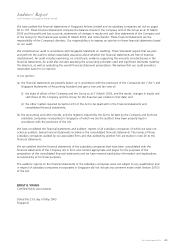
Group Value Added Productivity Ratios
Dollar
Dollar
1998-99 1999-00 2000-01 2001-02 2002-03
Value Added per $ Employment Costs
Value Added per $ Revenue
Value Added per $ Investment in Fixed Assets
3.0
2.4
1.8
1.2
0.6
0
3.0
2.4
1.8
1.2
0.6
0
350
280
210
140
70
0
Group Staff Strength and Productivity
$ ‘000
Staff Number
Staff Strength
Revenue per Employee ($)
Value Added per Employee ($)
50,000
40,000
30,000
20,000
10,000
0
1998-99 1999-00 2000-01 2001-02 2002-03
Group Value Added
$ Million
$ Million
1998-99 1999-00 2000-01 2001-02 2002-03
-500
0
500
1000
1500
2000
2500
3000
-500
0
500
1000
1500
2000
2500
3000
Retained in the Business
Employees
Suppliers of Capital
Government