Singapore Airlines 2003 Annual Report Download - page 104
Download and view the complete annual report
Please find page 104 of the 2003 Singapore Airlines annual report below. You can navigate through the pages in the report by either clicking on the pages listed below, or by using the keyword search tool below to find specific information within the annual report.-
 1
1 -
2
-
3
-
4
-
5
-
6
-
7
-
8
-
9
-
10
-
11
-
12
-
13
-
14
-
15
-
16
-
17
-
18
-
19
-
20
-
21
-
22
-
23
-
24
-
25
-
26
-
27
-
28
-
29
-
30
-
31
-
32
-
33
-
34
-
35
-
36
-
37
-
38
-
39
-
40
-
41
-
42
-
43
-
44
-
45
-
46
-
47
-
48
-
49
-
50
-
51
-
52
-
53
-
54
-
55
-
56
-
57
-
58
-
59
-
60
-
61
-
62
-
63
-
64
-
65
-
66
-
67
-
68
-
69
-
70
-
71
-
72
-
73
-
74
-
75
-
76
-
77
-
78
-
79
-
80
-
81
-
82
-
83
-
84
-
85
-
86
-
87
-
88
-
89
-
90
-
91
-
92
-
93
-
 94
94 -
 95
95 -
 96
96 -
 97
97 -
 98
98 -
 99
99 -
 100
100 -
 101
101 -
 102
102 -
 103
103 -
 104
104 -
 105
105 -
 106
106 -
 107
107 -
 108
108 -
 109
109 -
 110
110 -
 111
111 -
 112
112 -
 113
113 -
 114
114 -
115
-
116
-
117
-
118
-
119
-
120
-
121
-
122
-
123
-
124
-
125
-
126
-
127
-
128
 |
 |
102 SIA Annual Report 02/03
Notes to the Financial Statements
31 March 2003
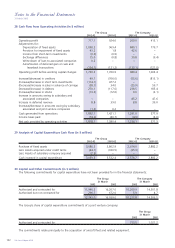
28 Cash Flow from Operating Activities (in $ million)
The Group The Company
2002-03 2001-02 2002-03 2001-02
Operating profit 717.1 924.6 209.0 413.1
Adjustments for:
Depreciation of fixed assets 1,090.3 969.4 840.1 779.7
Provision for impairment of fixed assets 43.2 1.8 42.6 –
Income from short-term investments (0.9) (6.9) – –
Exchange differences 15.0 (0.8) 30.8 (9.4)
Write-down of loan to associated companies 0.2 – – –
Amortization of deferred gain on sale and
leaseback transactions (134.7) (121.2) (133.1) (121.0)
Operating profit before working capital changes 1,730.2 1,766.9 989.4 1,062.4
Increase/(decrease) in creditors 49.7 (766.0) (55.6) (813.1)
(Increase)/decrease in short term investments (114.1) 477.2 – –
(Decrease)/increase in sales in advance of carriage (38.1) 34.0 (25.9) 59.7
Decrease/(increase) in debtors 270.1 (117.6) 238.5 185.4
(Increase)/decrease in stocks (13.3) (12.6) 0.6 (3.1)
Increase in amounts owing to subsidiary and
associated companies – – 85.2 47.6
Increase in deferred revenue 8.8 39.0 8.8 39.0
(Increase)/decrease in amounts owing by subsidiary,
associated and joint venture companies (1.2) 0.2 – –
Cash generated from operations 1,892.1 1,421.1 1,241.0 577.9
Income taxes paid (74.0) (40.7) (4.9) (6.6)
Net cash provided by operating activities 1,818.1 1,380.4 1,236.1 571.3
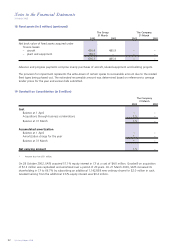
29 Analysis of Capital Expenditure Cash Flow (in $ million)
The Group The Company
2002-03 2001-02 2002-03 2001-02
Purchase of fixed assets 3,086.3 3,862.9 2,614.0 2,882.2
Less: Assets acquired under credit terms (44.1) (330.5) (35.3) –
Less: Assets of subsidiary company acquired (2.9) – – –
Cash invested in capital expenditure 3,039.3 3,532.4 2,578.7 2,882.2
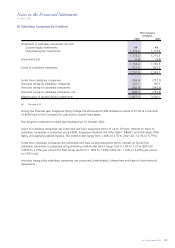
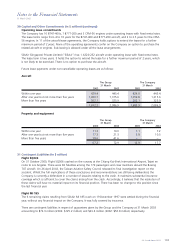
30 Capital and Other Commitments (in $ million)
The following commitments for capital expenditure have not been provided for in the financial statements:
The Group The Company
31 March 31 March
2003 2002 2003 2002
Authorized and contracted for 11,946.3 16,267.0 10,209.9 14,501.8
Authorized but not contracted for 296.7 672.0 5.9 4.7
12,243.0 16,939.0 10,215.8 14,506.5
The Group’s share of capital expenditure commitments of a joint venture company:
The Group
31 March
2003 2002
Authorized and contracted for 713.5 1,021.2
The commitments relate principally to the acquisition of aircraft fleet and related equipment.