Singapore Airlines 2003 Annual Report Download - page 44
Download and view the complete annual report
Please find page 44 of the 2003 Singapore Airlines annual report below. You can navigate through the pages in the report by either clicking on the pages listed below, or by using the keyword search tool below to find specific information within the annual report.-
 1
1 -
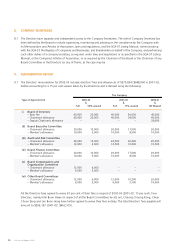
2
-
3
-
4
-
5
-
6
-
7
-
8
-
9
-
10
-
11
-
12
-
13
-
14
-
15
-
16
-
17
-
18
-
19
-
20
-
21
-
22
-
23
-
24
-
25
-
26
-
27
-
28
-
29
-
30
-
31
-
32
-
33
-
 34
34 -
 35
35 -
 36
36 -
 37
37 -
 38
38 -
 39
39 -
 40
40 -
 41
41 -
 42
42 -
 43
43 -
 44
44 -
 45
45 -
 46
46 -
 47
47 -
 48
48 -
 49
49 -
 50
50 -
 51
51 -
 52
52 -
 53
53 -
 54
54 -
55
-
56
-
57
-
58
-
59
-
60
-
61
-
62
-
63
-
64
-
65
-
66
-
67
-
68
-
69
-
70
-
71
-
72
-
73
-
74
-
75
-
76
-
77
-
78
-
79
-
80
-
81
-
82
-
83
-
84
-
85
-
86
-
87
-
88
-
89
-
90
-
91
-
92
-
93
-
94
-
95
-
96
-
97
-
98
-
99
-
100
-
101
-
102
-
103
-
104
-
105
-
106
-
107
-
108
-
109
-
110
-
111
-
112
-
113
-
114
-
115
-
116
-
117
-
118
-
119
-
120
-
121
-
122
-
123
-
124
-
125
-
126
-
127
-
128
 |
 |

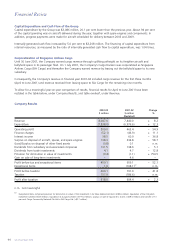
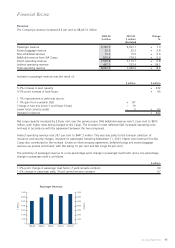
Group Earnings
Despite reporting a profit attributable to shareholders of $1,065 million, a 68.6 per cent increase over the previous
year, the Group’s performance was adversely affected by weak economic conditions and other external events.
The combined impact of the October 2002 bomb blasts in Bali, higher fuel prices, and a slowdown in traffic prior to
the war in Iraq, resulted in an operating profit of $207.3 million in the second half year, down 56.1% from the
corresponding period of the year before. However, the outbreak of SARS in mid March 2003 happened late in the
financial year and had little effect on the cumulative results.
The drop in operating profit was largely the result of lower operating profit by the Company (-$254 million) and two
of its major subsidiaries: the SIA Engineering Company group (-$63 million) and the Singapore Airport Terminal Services
group (-$37 million). Singapore Airlines Cargo was a notable exception, recording an operating profit of $63 million,
compared with last year’s $91 million loss.
Although revenue reached an all-time high of $10,515 million, an increase of 12.1 per cent over the previous year,
operating costs rose by an even higher margin of 15.8 per cent, pushing the Group’s expenditure to $9,798 million.
A profit-sharing bonus amounting to $304 million, payable in accordance with the staff’s profit sharing plan, accounted
for 22.7 percent of the rise in operating costs. No bonus was paid the previous year.
The SIA Group’s profit before tax was $977 million, up 5.5 per cent from the previous year. The increase of $51 million
was due mainly to a bigger surplus from the sale of aircraft and higher profits from associated companies. A tax
writeback of $278 million, arising from a reduction in the corporate tax to 22 per cent, helped to boost profit
attributable to shareholders to $1,065 million. Without this writeback, which resulted mainly from the provision for
deferred tax in previous years, profit attributable to shareholders would have been $787 million.
The Group’s basic earnings per share rose 35.5 cents to 87.4 cents.
42 SIA Annual Report 02/03
Financial Review
Group Revenue and Expenditure
$ Million
$ Million
1998-99 1999-00 2000-01 2001-02 2002-03
Revenue
Expenditure
12,000
10,000
8,000
6,000
4,000
2,000
0
12,000
10,000
8,000
6,000
4,000
2,000
0
Group Operating Profit, Profit Before Tax
and Profit Attributable to Shareholders
$ Million
$ Million
1998-99 1999-00 2000-01 2001-02 2002-03
Profit Before Tax
Profit Attributable to Shareholders
Operating Profit
2,000
1,500
1,000
500
2,000
1,500
1,000
500