Singapore Airlines 2003 Annual Report Download - page 47
Download and view the complete annual report
Please find page 47 of the 2003 Singapore Airlines annual report below. You can navigate through the pages in the report by either clicking on the pages listed below, or by using the keyword search tool below to find specific information within the annual report.-
 1
1 -
2
-
3
-
4
-
5
-
6
-
7
-
8
-
9
-
10
-
11
-
12
-
13
-
14
-
15
-
16
-
17
-
18
-
19
-
20
-
21
-
22
-
23
-
24
-
25
-
26
-
27
-
28
-
29
-
30
-
31
-
32
-
33
-
34
-
35
-
36
-
 37
37 -
 38
38 -
 39
39 -
 40
40 -
 41
41 -
 42
42 -
 43
43 -
 44
44 -
 45
45 -
 46
46 -
 47
47 -
 48
48 -
 49
49 -
 50
50 -
 51
51 -
 52
52 -
 53
53 -
 54
54 -
 55
55 -
 56
56 -
 57
57 -
58
-
59
-
60
-
61
-
62
-
63
-
64
-
65
-
66
-
67
-
68
-
69
-
70
-
71
-
72
-
73
-
74
-
75
-
76
-
77
-
78
-
79
-
80
-
81
-
82
-
83
-
84
-
85
-
86
-
87
-
88
-
89
-
90
-
91
-
92
-
93
-
94
-
95
-
96
-
97
-
98
-
99
-
100
-
101
-
102
-
103
-
104
-
105
-
106
-
107
-
108
-
109
-
110
-
111
-
112
-
113
-
114
-
115
-
116
-
117
-
118
-
119
-
120
-
121
-
122
-
123
-
124
-
125
-
126
-
127
-
128
 |
 |
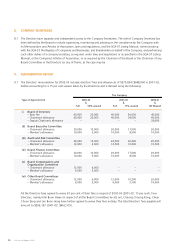
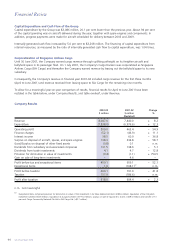
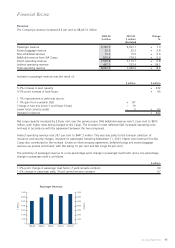
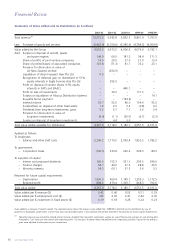
Revenue
The Company’s revenue increased 8.2 per cent to $8,047.0 million.
2002-03 2001-02 Change
$ million $ million %
(Restated)
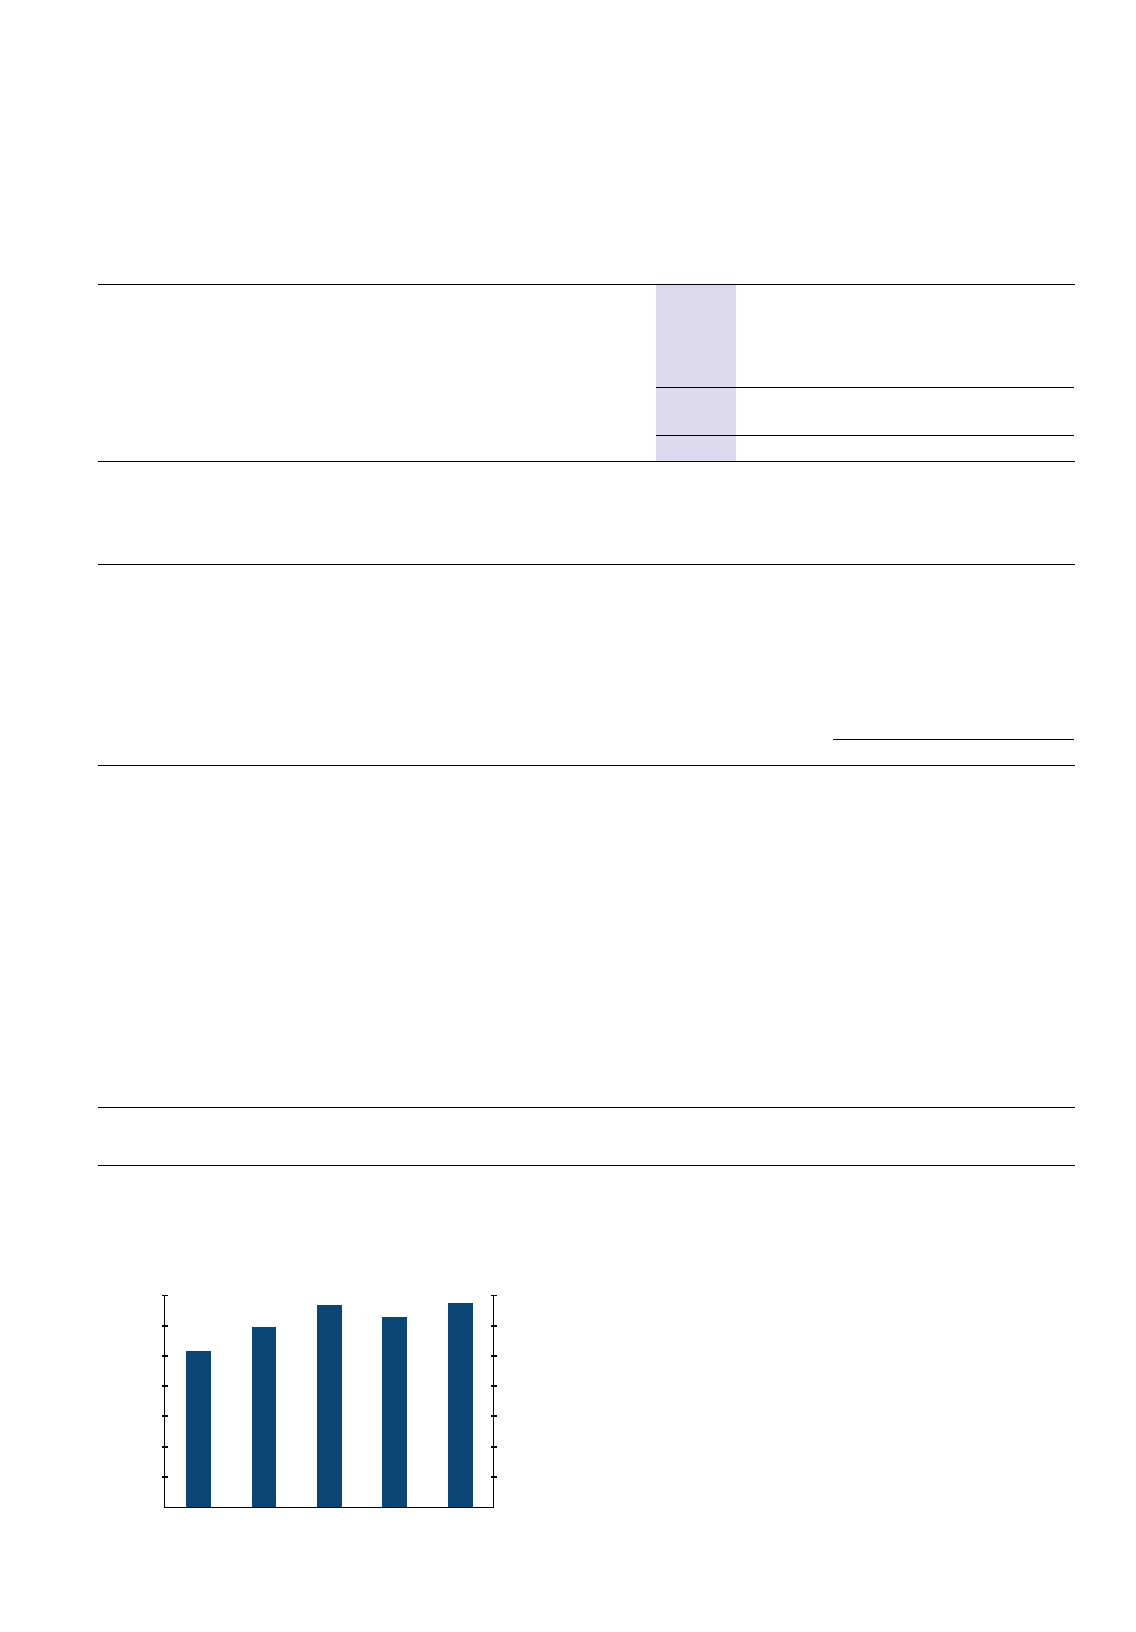
Passenger revenue 6,742.9 6,301.1 + 7.0
Excess baggage revenue 25.9 25.2 + 2.8
Non-scheduled services 15.6 15.5 + 0.6
Bellyhold revenue from SIA Cargo 815.4 774.3 + 5.3
Direct operating revenue 7,599.8 7,116.1 + 6.8
Indirect operating revenue 447.2 323.9 + 38.1
Total operating revenue 8,047.0 7,440.0 + 8.2
Increase in passenger revenue was the result of:
$ million $ million
5.3% increase in seat capacity + 332
0.5% point increase in load factor +45
1.1% improvement in yield was due to:
1.7% gain from a weaker SGD + 87
Change in fare mix (more Y and fewer PJ pax) – 19
Lower local currency yields – 3 + 65
Increase in revenue + 442
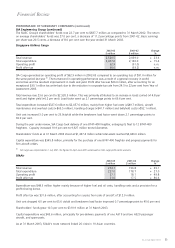
Net cargo capacity increased by 2.8 per cent over the previous year. SIA’s bellyhold revenue rose 5.3 per cent to $815
million, with higher rates being charged to SIA Cargo. The increase in rates reflected SIA’s increased operating costs
and was in accordance with the agreement between the two companies.
Indirect operating revenue rose 38.1 per cent to $447.2 million. This was due partly to the full-year collection of
insurance and security charges, imposed on passengers following September 11, 2001. Higher pool revenue from SIA
Cargo also contributed to the increase. (Under an inter-company agreement, bellyhold cargo and excess baggage
revenue are pooled and shared, with SIA taking 10 per cent and SIA Cargo 90 per cent.)
The sensitivity of passenger revenue to a one percentage point change in passenger load factor and a one percentage
change in passenger yield is as follows:
$ million
1.0% point change in passenger load factor, if yield remains constant 90
1.0% change in passenger yield, if load carried remains constant 67
45
SIA Annual Report 02/03
Financial Review
7,000
6,000
5,000
4,000
3,000
2,000
1,000
0
Passenger Revenue
$ Million
$ Million
1998-99 1999-00 2000-01 2001-02 2002-03
7,000
6,000
5,000
4,000
3,000
2,000
1,000
0