Singapore Airlines 2003 Annual Report Download - page 49
Download and view the complete annual report
Please find page 49 of the 2003 Singapore Airlines annual report below. You can navigate through the pages in the report by either clicking on the pages listed below, or by using the keyword search tool below to find specific information within the annual report.-
 1
1 -
2
-
3
-
4
-
5
-
6
-
7
-
8
-
9
-
10
-
11
-
12
-
13
-
14
-
15
-
16
-
17
-
18
-
19
-
20
-
21
-
22
-
23
-
24
-
25
-
26
-
27
-
28
-
29
-
30
-
31
-
32
-
33
-
34
-
35
-
36
-
37
-
38
-
 39
39 -
 40
40 -
 41
41 -
 42
42 -
 43
43 -
 44
44 -
 45
45 -
 46
46 -
 47
47 -
 48
48 -
 49
49 -
 50
50 -
 51
51 -
 52
52 -
 53
53 -
 54
54 -
 55
55 -
 56
56 -
 57
57 -
 58
58 -
 59
59 -
60
-
61
-
62
-
63
-
64
-
65
-
66
-
67
-
68
-
69
-
70
-
71
-
72
-
73
-
74
-
75
-
76
-
77
-
78
-
79
-
80
-
81
-
82
-
83
-
84
-
85
-
86
-
87
-
88
-
89
-
90
-
91
-
92
-
93
-
94
-
95
-
96
-
97
-
98
-
99
-
100
-
101
-
102
-
103
-
104
-
105
-
106
-
107
-
108
-
109
-
110
-
111
-
112
-
113
-
114
-
115
-
116
-
117
-
118
-
119
-
120
-
121
-
122
-
123
-
124
-
125
-
126
-
127
-
128
 |
 |
47
SIA Annual Report 02/03
Financial Review
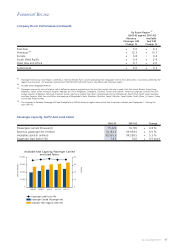
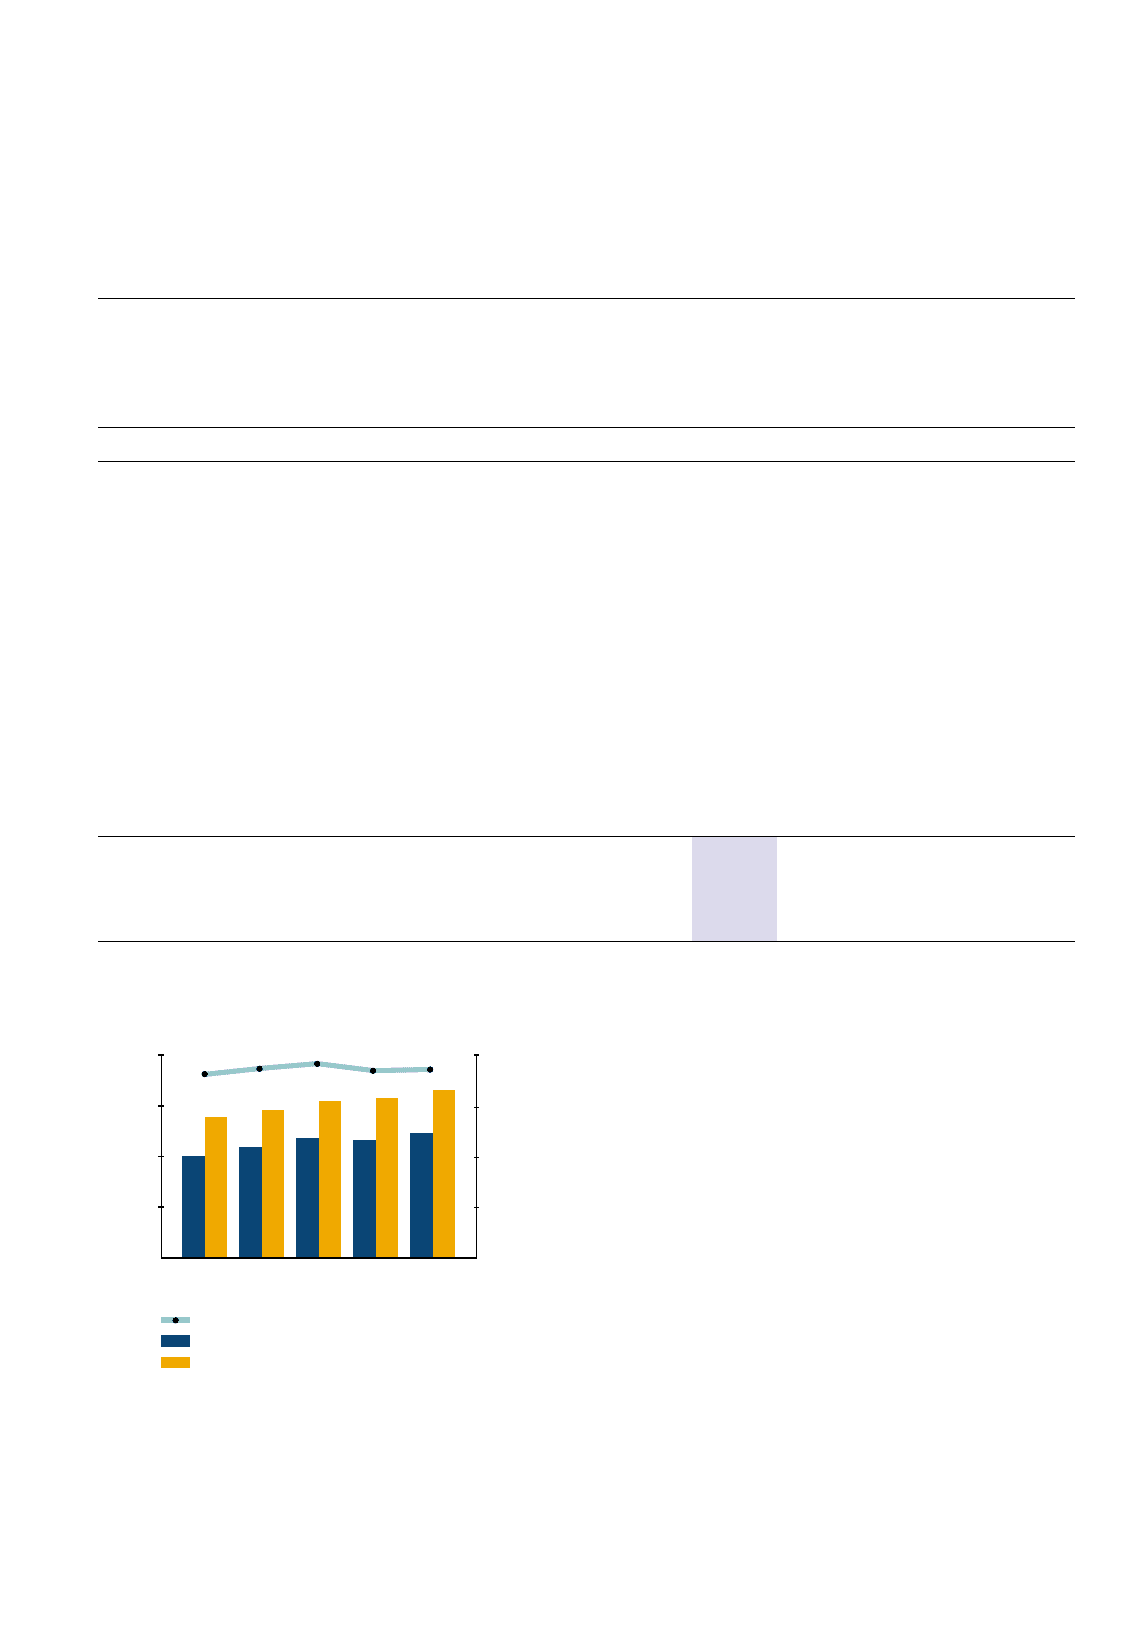
80
60
40
20
0
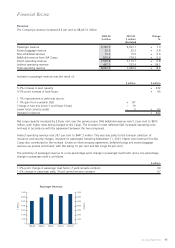
Available Seat Capacity, Passenger Carried
and Load Factor
Percent
Seat-km (Million)
1998-99 1999-00 2000-01 2001-02 2002-03
Passenger Load Factor (%)
Passenger Carried (Passenger-km)
Available Seat Capacity (Seat-km)
120,000
90,000
60,000
30,000
0
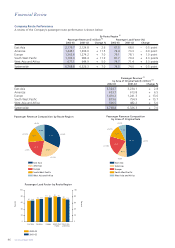
Company Route Performance (continued)
By Route Region R1
(2002-03 against 2001-02)
Revenue Available
Passenger KM Seat KM
Change % Change %
East Asia + 5.6 + 6.3
Americas R4 + 12.3 + 13.7
Europe + 0.8 – 0.4
South West Pacific + 5.4 + 2.4
West Asia and Africa + 6.7 + 2.0
Systemwide + 6.0 + 5.3
R1 Passenger revenue by route region is defined as revenue derived from a route originating from Singapore with its final destination in countries covered by the
region and vice versa. For example, revenue from SIN-HKG-SFO-HKG-SIN route is classified under Americas region.
R2 Includes excess baggage revenue.
R3 Passenger revenue by area of original sale is defined as revenue originating in the area from which the sale is made. East Asia covers Brunei, Hong Kong,
Indonesia, Japan, Korea, Malaysia, People's Republic of China, Philippines, Singapore, Thailand, Taiwan and Vietnam. Americas comprises Canada and USA.
Europe consists of Belgium, Denmark, England, France, Germany, Greece, Italy, Spain, Switzerland and The Netherlands. South West Pacific covers Australia
and New Zealand. West Asia and Africa are made up of Bangladesh, India, Maldives, Mauritius, Nepal, Pakistan, Saudi Arabia, South Africa, Sri Lanka, Turkey
and United Arab Emirates.
R4 The increases in Revenue Passenger KM and Available Seat KM for Americas region were mainly due to services cutbacks post September 11 during the
year 2001-02.
Passenger Capacity, Traffic And Load Factor
2002-03 2001-02 Change
Passengers carried (thousand) 15,326 14,765 + 3.8 %
Revenue passenger-km (million) 74,183.2 69,994.5 + 6.0 %
Available seat-km (million) 99,565.9 94,558.5 + 5.3 %
Passenger load factor (%) 74.5 74.0 + 0.5 point