Singapore Airlines 2003 Annual Report Download - page 113
Download and view the complete annual report
Please find page 113 of the 2003 Singapore Airlines annual report below. You can navigate through the pages in the report by either clicking on the pages listed below, or by using the keyword search tool below to find specific information within the annual report.-
 1
1 -
2
-
3
-
4
-
5
-
6
-
7
-
8
-
9
-
10
-
11
-
12
-
13
-
14
-
15
-
16
-
17
-
18
-
19
-
20
-
21
-
22
-
23
-
24
-
25
-
26
-
27
-
28
-
29
-
30
-
31
-
32
-
33
-
34
-
35
-
36
-
37
-
38
-
39
-
40
-
41
-
42
-
43
-
44
-
45
-
46
-
47
-
48
-
49
-
50
-
51
-
52
-
53
-
54
-
55
-
56
-
57
-
58
-
59
-
60
-
61
-
62
-
63
-
64
-
65
-
66
-
67
-
68
-
69
-
70
-
71
-
72
-
73
-
74
-
75
-
76
-
77
-
78
-
79
-
80
-
81
-
82
-
83
-
84
-
85
-
86
-
87
-
88
-
89
-
90
-
91
-
92
-
93
-
94
-
95
-
96
-
97
-
98
-
99
-
100
-
101
-
102
-
 103
103 -
 104
104 -
 105
105 -
 106
106 -
 107
107 -
 108
108 -
 109
109 -
 110
110 -
 111
111 -
 112
112 -
 113
113 -
 114
114 -
 115
115 -
 116
116 -
 117
117 -
 118
118 -
 119
119 -
 120
120 -
 121
121 -
 122
122 -
 123
123 -
124
-
125
-
126
-
127
-
128
 |
 |

111
SIA Annual Report 02/03
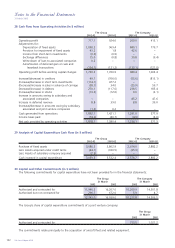
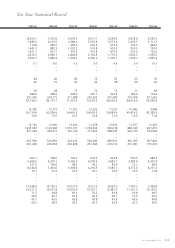
Five-Year Financial Summary of the Group
2002-03 2001-02 2000-01 1999-00 1998-99
CASH FLOW STATEMENTS ($ million)
Cash flow from operations 1,892.1 1,421.1 2,644.7 2,429.0 1,772.9
Internally generated cash flow R2 3,207.7 3,054.1 3,438.7 3,239.3 2,798.1
Capital expenditure 3,086.3 3,862.9 2,589.0 1,911.5 2,053.1
PER SHARE DATA
Earnings before tax (cents) 80.2 76.0 155.5 115.0 87.1
Earnings after tax (cents) – basic 87.4 51.9 132.7 91.4 80.6
– diluted 87.4 51.9 132.6 91.4 80.6
Cash earnings ($) R3 1.77 1.31 2.26 1.86 1.72
Net asset value ($) 8.79 8.08 8.19 7.41 8.23
SHARE PRICE R4
High 14.40 14.90 19.20 20.80 13.60
Low 8.55 7.00 12.90 12.40 6.40
Closing 8.75 14.40 13.60 16.00 12.50
DIVIDENDS
Gross dividends (cents per share) 15.0 15.0 R5 35.0 30.0 R6 25.0 R7
Dividend cover (times) 6.4 4.1 5.1 3.9 4.3
PROFITABILITY RATIOS (%)
Return on shareholders’ funds 10.4 6.4 16.9 11.7 10.2
Return on total assets 5.9 3.8 9.7 7.0 6.3
Return on turnover 10.6 7.4 16.7 12.9 13.1
PRODUCTIVITY AND EMPLOYEE DATA
Value added ($ million) 4,367.0 3,718.2 5,180.7 4,551.5 4,101.0
Value added per employee ($) 144,397 126,375 182,831 165,431 146,958
Revenue per employee ($) 347,684 318,904 347,692 322,080 279,402
Average employee strength 30,243 29,422 28,336 27,513 27,906
US$/S$ exchange rate as at 31 March 1.7640 1.8405 1.8029 1.7185 1.7295
R1 Operating profit was restated to better reflect the performance of operating activities. Non-operating items are now shown after operating profit. Previous
year’s figures have been adjusted to allow year-on-year comparison.
R2 Internally generated cash flow comprised cash generated from operations, dividends from associated companies, and proceeds from sale of aircraft and
other fixed assets.
R3 Cash earnings is defined as profit after tax and minority interests plus depreciation.
R4 SIA local shares and SIA foreign shares were merged (following approval of the merger by shareholders at the Company’s extraordinary general meeting)
on 11 September 1999. For comparison, share prices for 1998-99 were that of SIA foreign share.
R5 Includes 4.0 cents per share tax-exempt dividend.
R6 Includes 4.75 cents per share tax-exempt dividend.
R7 Includes 1.0 cent per share tax-exempt dividend.