Singapore Airlines 2003 Annual Report Download - page 56
Download and view the complete annual report
Please find page 56 of the 2003 Singapore Airlines annual report below. You can navigate through the pages in the report by either clicking on the pages listed below, or by using the keyword search tool below to find specific information within the annual report.-
 1
1 -
2
-
3
-
4
-
5
-
6
-
7
-
8
-
9
-
10
-
11
-
12
-
13
-
14
-
15
-
16
-
17
-
18
-
19
-
20
-
21
-
22
-
23
-
24
-
25
-
26
-
27
-
28
-
29
-
30
-
31
-
32
-
33
-
34
-
35
-
36
-
37
-
38
-
39
-
40
-
41
-
42
-
43
-
44
-
45
-
 46
46 -
 47
47 -
 48
48 -
 49
49 -
 50
50 -
 51
51 -
 52
52 -
 53
53 -
 54
54 -
 55
55 -
 56
56 -
 57
57 -
 58
58 -
 59
59 -
 60
60 -
 61
61 -
 62
62 -
 63
63 -
 64
64 -
 65
65 -
 66
66 -
67
-
68
-
69
-
70
-
71
-
72
-
73
-
74
-
75
-
76
-
77
-
78
-
79
-
80
-
81
-
82
-
83
-
84
-
85
-
86
-
87
-
88
-
89
-
90
-
91
-
92
-
93
-
94
-
95
-
96
-
97
-
98
-
99
-
100
-
101
-
102
-
103
-
104
-
105
-
106
-
107
-
108
-
109
-
110
-
111
-
112
-
113
-
114
-
115
-
116
-
117
-
118
-
119
-
120
-
121
-
122
-
123
-
124
-
125
-
126
-
127
-
128
 |
 |

54 SIA Annual Report 02/03
Financial Review
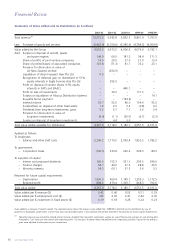
Statement of Value Added and its Distribution (in $ million)
2002-03 2001-02 2000-01 1999-00 1998-99
Total revenue R1 10,515.0 9,382.8 9,852.2 8,861.4 7,797.0
Less: Purchase of goods and services (6,462.4) (5,709.6) (5,345.6) (4,784.5) (4,054.9)
Value added by the Group 4,052.6 3,673.2 4,506.6 4,076.9 3,742.1
Add: Surplus on disposal of aircraft, spares
and spare engines 144.9 66.0 181.3 98.4 211.3
Share of profits of joint venture companies 14.5 20.5 27.0 21.0 13.9
Share of profits/(losses) of associated companies 123.8 (71.3) 81.7 33.2 23.1
Provision for diminution in value of
Air New Zealand Limited – (266.9) – – –
Liquidation of Asian Frequent Flyer Pte Ltd 0.5 ––––
Recognition of deferred gain on divestment of 51%
equity interests in Eagle Services Asia Pte Ltd – 202.6 – – –
Profit on disposal of vendor shares (13% equity
interests in SATS and SIAEC) – – 440.1 – –
Profit on sale of investments – 30.2 – 171.3 –
Surplus on liquidation of Abacus Distribution Systems ––––14.1
Ex-gratia bonus payment – – (134.6) – –
Interest income 33.7 52.0 86.0 154.6 95.2
Surplus/(loss) on disposal of other fixed assets 1.2 2.9 2.4 (0.8) 0.2
Dividends from long-term investments, gross 5.2 5.7 7.7 3.6 3.4
Provision for diminution in value of
long-term investments (9.4) (1.1) (20.5) (6.7) (2.3)
Surplus on disposal of long-term investments – 4.4 3.0 – –
Total value added available for distribution 4,367.0 3,718.2 5,180.7 4,551.5 4,101.0
Applied as follows:
To employees
– Salaries and other staff costs 2,245.2 1,779.2 2,093.4 1,853.5 1,782.2
To government
– Corporation taxes (142.5) 233.8 242.4 296.5 80.3
To suppliers of capital
– Interim and proposed dividends 166.6 152.3 321.1 295.5 240.6
– Finance charges 54.7 44.0 37.5 28.8 29.5
– Minority interests 54.5 60.1 37.5 3.6 3.3
Retained for future capital requirements
– Depreciation 1,090.3 969.4 1,145.1 1,205.3 1,172.5
– Retained profit 898.2 479.4 1,303.7 868.3 792.6
Total value added 4,367.0 3,718.2 5,180.7 4,551.5 4,101.0
Value added per $ revenue ($) 0.42 0.40 0.53 0.51 0.53
Value added per $ employment cost ($) 1.95 2.09 2.47 2.46 2.30
Value added per $ investment in fixed assets ($) 0.19 0.18 0.28 0.24 0.23
Value added is a measure of wealth created. The statement above shows the Group's value added from 1998-99 to 2002-03 and its distribution by way of
payments to employees, government, and to those who have provided capital. It also indicates the portion retained in the business for future capital requirements.
R1 Operating revenue was restated to exclude interest income, dividend from long-term investments, surplus on sale of fixed assets and gain on sale of long-term
investments. Such items are now shown after operating profit. The change is to better reflect the performance of operating activities. Figures for the previous
years were adjusted to allow year-on-year comparisons.