Singapore Airlines 2003 Annual Report Download - page 54
Download and view the complete annual report
Please find page 54 of the 2003 Singapore Airlines annual report below. You can navigate through the pages in the report by either clicking on the pages listed below, or by using the keyword search tool below to find specific information within the annual report.-
 1
1 -
2
-
3
-
4
-
5
-
6
-
7
-
8
-
9
-
10
-
11
-
12
-
13
-
14
-
15
-
16
-
17
-
18
-
19
-
20
-
21
-
22
-
23
-
24
-
25
-
26
-
27
-
28
-
29
-
30
-
31
-
32
-
33
-
34
-
35
-
36
-
37
-
38
-
39
-
40
-
41
-
42
-
43
-
 44
44 -
 45
45 -
 46
46 -
 47
47 -
 48
48 -
 49
49 -
 50
50 -
 51
51 -
 52
52 -
 53
53 -
 54
54 -
 55
55 -
 56
56 -
 57
57 -
 58
58 -
 59
59 -
 60
60 -
 61
61 -
 62
62 -
 63
63 -
 64
64 -
65
-
66
-
67
-
68
-
69
-
70
-
71
-
72
-
73
-
74
-
75
-
76
-
77
-
78
-
79
-
80
-
81
-
82
-
83
-
84
-
85
-
86
-
87
-
88
-
89
-
90
-
91
-
92
-
93
-
94
-
95
-
96
-
97
-
98
-
99
-
100
-
101
-
102
-
103
-
104
-
105
-
106
-
107
-
108
-
109
-
110
-
111
-
112
-
113
-
114
-
115
-
116
-
117
-
118
-
119
-
120
-
121
-
122
-
123
-
124
-
125
-
126
-
127
-
128
 |
 |

52 SIA Annual Report 02/03
Financial Review
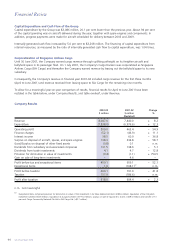
PERFORMANCE OF SUBSIDIARY COMPANIES
There were 25 subsidiary companies in the SIA Group as at 31 March 2003. The major subsidiary companies are
Singapore Airport Terminal Services Limited (SATS), SIA Engineering Company Limited (SIAEC), Singapore Airlines Cargo
Private Limited (SIA Cargo), and SilkAir (Singapore) Private Limited. The following review of their performances excludes
adjustments for inter-company transactions.
Singapore Airport Terminal Services Group
2002-03 2001-02 Change
$ million $ million %
Total revenue 958.1 895.3 + 7.0
Total expenditure 729.9 628.6 + 16.1
Operating profit 228.2 266.7 – 14.4
Profit after tax 214.8 212.8 + 0.9
The SATS Group’s profit after tax for the financial year improved marginally to $214.8 million. Revenue was up $62.8
million: ground handling revenue increased $37.9 million because of more cargo handled; inflight catering revenue was
$9.8 million higher than the preceding year as a result of an increase in the number of meals sold; while revenue from
other services grew $15.1 million mainly because of additional security services purchased by airlines after September
11, 2001. Expenditure increased 16.1 per cent to $729.9 million, mainly as a result of higher staff costs (+$78.3
million) which increased significantly due to a profit-sharing bonus being provided, based on the profits of the SIA
Group. Without this provision, as was the case the year before, operating profit would have increased 7.4 per cent.
Other operating expenditure (excluding staff costs) increased 7.6 percent to $23.0 million because of higher
expenditure on (i) insurance (+$5.1 million); (ii) licensing fees (+$4.1 million); and (iii) raw materials (+$3.0 million), the
latter as a result of more meals produced. Depreciation charges and building maintenance costs rose $3.6 million and
$2.3 million respectively.
Share of profits from overseas operations through associated companies improved $8.6 million to $31.1 million,
representing 12.0 per cent of the SATS Group’s profit before tax.
Profit before taxation for the SATS Group was $258.1 million, a decline of $29.4 million. However, the SATS Group’s profit
after tax was 0.9 per cent better because of a $17.8 million tax write-back for financial year 2001-02 from the reduction
in Singapore corporate tax rate. The tax write-back was reported earlier in the release of the results for the period.
The SATS Group’s shareholders’ funds rose $156.5 million (+16.8 per cent) to $1,086.8 million. Return on average
shareholders’ funds decreased 3.9 percentage points to 21.3 per cent. Earnings per share improved 0.2 cent to 21.5
cents and net asset value per share rose 15.7 cents to $1.09.
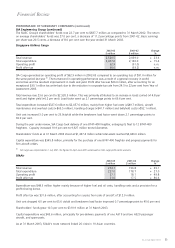
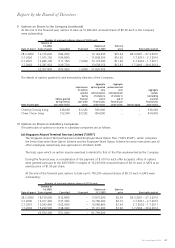
SIA Engineering Group
2002-03 2001-02 Change
$ million $ million %
Total revenue 878.1 835.6 + 5.1
Total expenditure 737.1 631.9 + 16.6
Operating profit 141.0 203.7 – 30.8
Profit after tax 205.3 223.2 – 8.0
The SIAEC Group’s revenue grew $42.5 million to $878.1 million. Expenditure increased at a higher rate of 16.6 per cent
to $737.1 million, contributed mainly by a provision for a profit-sharing bonus, higher aviation insurance premium and
lower recovery of doubtful debts.
The SIAEC Group’s operating profit was $141.0 million, a decrease of $62.7 million from the year before.
Profit before tax declined $36.1 million to $216.4 million, mainly due to an increase of $28.7 million in the share of
profits from associated companies and joint venture companies. Sixteen associated companies and joint ventures in
Singapore, China, Hong Kong, Taiwan and Ireland generated about $2.0 billion in revenue, with 73.0 per cent derived
from airlines outside the SIA Group, and employed about 4,300 staff. The SIAEC Group’s share of profits of associated
companies, which amounted to $71.1 million, was 32.9 per cent of its pre-tax profit.
The SIAEC Group’s operating profit and profit after tax were significantly impacted by a $51.2 million provision for a
profit-sharing bonus. If there had been no such provision, as was the case the year before, operating profit would have
declined 5.6 per cent and profit after tax, aided by a higher profit contribution from associated companies, would have
risen by 15.0 per cent.