Singapore Airlines 2003 Annual Report Download - page 58
Download and view the complete annual report
Please find page 58 of the 2003 Singapore Airlines annual report below. You can navigate through the pages in the report by either clicking on the pages listed below, or by using the keyword search tool below to find specific information within the annual report.-
 1
1 -
2
-
3
-
4
-
5
-
6
-
7
-
8
-
9
-
10
-
11
-
12
-
13
-
14
-
15
-
16
-
17
-
18
-
19
-
20
-
21
-
22
-
23
-
24
-
25
-
26
-
27
-
28
-
29
-
30
-
31
-
32
-
33
-
34
-
35
-
36
-
37
-
38
-
39
-
40
-
41
-
42
-
43
-
44
-
45
-
46
-
47
-
 48
48 -
 49
49 -
 50
50 -
 51
51 -
 52
52 -
 53
53 -
 54
54 -
 55
55 -
 56
56 -
 57
57 -
 58
58 -
 59
59 -
 60
60 -
 61
61 -
 62
62 -
 63
63 -
 64
64 -
 65
65 -
 66
66 -
 67
67 -
 68
68 -
69
-
70
-
71
-
72
-
73
-
74
-
75
-
76
-
77
-
78
-
79
-
80
-
81
-
82
-
83
-
84
-
85
-
86
-
87
-
88
-
89
-
90
-
91
-
92
-
93
-
94
-
95
-
96
-
97
-
98
-
99
-
100
-
101
-
102
-
103
-
104
-
105
-
106
-
107
-
108
-
109
-
110
-
111
-
112
-
113
-
114
-
115
-
116
-
117
-
118
-
119
-
120
-
121
-
122
-
123
-
124
-
125
-
126
-
127
-
128
 |
 |
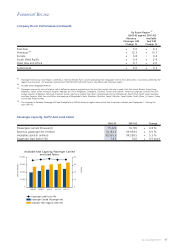
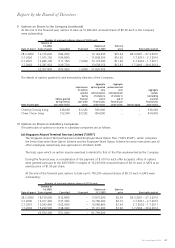
Staff Strength and Productivity
In 2002-03, the Company’s average staff strength was 14,418, an increase of 213 over the previous year. The
distribution of employee strength by category and location is as follows:
2002-03 2001-02 % Change
(Restated)
Category
Senior staff (administrative and higher ranking officers) 1,451 1,332 + 8.9
Technical crew 1,832 1,711 + 7.1
Cabin crew 6,768 6,721 + 0.7
Other ground staff 4,367 4,441 – 1.7
14,418 14,205 + 1.5
Location
Singapore 11,805 11,577 + 2.0
West Asia and Africa 284 313 – 9.3
Rest of Asia 1,133 1,135 – 0.2
Europe 529 522 + 1.3
South West Pacific 386 382 + 1.0
Americas 281 276 + 1.8
14,418 14,205 + 1.5
The Company’s staff productivity, measured by the average of changes in seat capacity produced, passenger load
carried, revenue earned, and value added per employee, increased 4.0 per cent over 2001-02 as shown below:
2002-03 2001-02 % Change
(Restated)
Seat capacity per employee (seat-km) R1 6,905,667 6,656,705 + 3.7
Passenger load carried per employee (tonne-km) R1 495,617 471,300 + 5.2
Revenue per employee ($) 558,122 523,759 + 6.6
Value added per employee ($) 191,566 190,891 + 0.4
Average productivity increase/decrease + 4.0
R1 Based on average staff strength of passenger operations. Passenger load includes excess baggage carried.
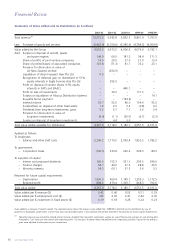
In 2002-03, average staff strength of subsidiary companies was 15,825, up 608. Head count increased in SIAEC Group
(+331), SATS Group (+100) and Singapore Airlines Cargo (+66).
The Group’s staff strength rose by 821 to 30,243 employees. A breakdown is as follows:
2002-03 2001-02 % Change
SIA Passenger Airline Company 14,418 14,205 + 1.5
SATS Group 9,327 9,227 + 1.1
SIA Engineering Group 4,624 4,293 + 7.7
Singapore Airlines Cargo 698 632 + 10.4
SilkAir 560 516 + 8.5
Others 616 549 + 12.2
30,243 29,422 + 2.8
Group revenue per employee was $347,684, up 9.0 per cent, while value added increased to $144,397.
56 SIA Annual Report 02/03
Financial Review