Singapore Airlines 2003 Annual Report Download - page 45
Download and view the complete annual report
Please find page 45 of the 2003 Singapore Airlines annual report below. You can navigate through the pages in the report by either clicking on the pages listed below, or by using the keyword search tool below to find specific information within the annual report.-
 1
1 -
2
-
3
-
4
-
5
-
6
-
7
-
8
-
9
-
10
-
11
-
12
-
13
-
14
-
15
-
16
-
17
-
18
-
19
-
20
-
21
-
22
-
23
-
24
-
25
-
26
-
27
-
28
-
29
-
30
-
31
-
32
-
33
-
34
-
 35
35 -
 36
36 -
 37
37 -
 38
38 -
 39
39 -
 40
40 -
 41
41 -
 42
42 -
 43
43 -
 44
44 -
 45
45 -
 46
46 -
 47
47 -
 48
48 -
 49
49 -
 50
50 -
 51
51 -
 52
52 -
 53
53 -
 54
54 -
 55
55 -
56
-
57
-
58
-
59
-
60
-
61
-
62
-
63
-
64
-
65
-
66
-
67
-
68
-
69
-
70
-
71
-
72
-
73
-
74
-
75
-
76
-
77
-
78
-
79
-
80
-
81
-
82
-
83
-
84
-
85
-
86
-
87
-
88
-
89
-
90
-
91
-
92
-
93
-
94
-
95
-
96
-
97
-
98
-
99
-
100
-
101
-
102
-
103
-
104
-
105
-
106
-
107
-
108
-
109
-
110
-
111
-
112
-
113
-
114
-
115
-
116
-
117
-
118
-
119
-
120
-
121
-
122
-
123
-
124
-
125
-
126
-
127
-
128
 |
 |

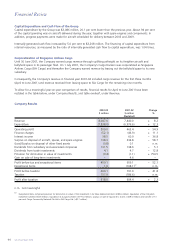
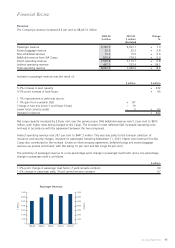
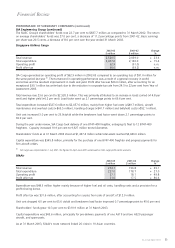
Financial Position of the Group
Net asset value per share for the Group was $8.79 at 31 March 2003, an improvement of 8.8 per cent compared to
31 March 2002.
The Group’s total assets increased 3.2 per cent to $19,184 million as at 31 March 2003.
Shareholders’ funds of the Group stood at $10,709 million on 31 March 2003, up 8.8 per cent from a year ago.
The net debt of the Group as at 31 March 2003 grew 9.5 per cent from a year ago, to $719 million. his was largely
the result of aircraft purchases. The net debt equity ratio remain unchanged at 0.07 time.
The Group’s profitability ratios are as follows:
2002-03 2001-02 Change
% % % points
Return on turnover 10.6 7.4 + 3.2
Return on total assets 5.9 3.8 + 2.1
Return on average shareholders’ funds 10.4 6.4 + 4.0
43
SIA Annual Report 02/03
Financial Review
2,500
2,000
1,500
1,000
500
0
-500
-1,000
Group Net Liquid Assets and Net Debt
$ Million
$ Million
1999 2000 2001 2002 2003
31 March
Net Liquid Assets
Net Debt
2,500
2,000
1,500
1,000
500
0
-500
-1,000
Group Capital Expenditure and
Internally Generated Cash Flow
1.8
1.5
1.2
0.9
0.6
0.3
0
Ratio
$ Million
1998-99 1999-00 2000-01 2001-02 2002-03
5,000
4,000
3,000
2,000
1,000
0
Cash Flow: Capital Expenditure Ratio
Other Capital Expenditure ($ million)
Capital Expenditure on Aircraft,
Engines and Spares ($ million)
Internally Generated Cash Flow ($ million)
140
105
70
35
0
Group Profitability Ratios
Cents
Percent
1998-99 1999-00 2000-01 2001-02 2002-03
Earnings per share (¢)
Return on Turnover (%)
Return on Shareholders' Funds (%)
Return on Total Assets (%)
25
20
15
10
5
0
10
8
6
4
2
0
Group Shareholders’ Funds, Total Assets
and Net Asset Value Per Share
Dollars
$ Million
1999 2000 2001 2002 2003
31 March
Shareholders’ Funds ($ million)
Total Assets ($ million)
NAV per share ($)
25,000
20,000
15,000
10,000
5,000
0