Singapore Airlines 2003 Annual Report Download - page 111
Download and view the complete annual report
Please find page 111 of the 2003 Singapore Airlines annual report below. You can navigate through the pages in the report by either clicking on the pages listed below, or by using the keyword search tool below to find specific information within the annual report.-
 1
1 -
2
-
3
-
4
-
5
-
6
-
7
-
8
-
9
-
10
-
11
-
12
-
13
-
14
-
15
-
16
-
17
-
18
-
19
-
20
-
21
-
22
-
23
-
24
-
25
-
26
-
27
-
28
-
29
-
30
-
31
-
32
-
33
-
34
-
35
-
36
-
37
-
38
-
39
-
40
-
41
-
42
-
43
-
44
-
45
-
46
-
47
-
48
-
49
-
50
-
51
-
52
-
53
-
54
-
55
-
56
-
57
-
58
-
59
-
60
-
61
-
62
-
63
-
64
-
65
-
66
-
67
-
68
-
69
-
70
-
71
-
72
-
73
-
74
-
75
-
76
-
77
-
78
-
79
-
80
-
81
-
82
-
83
-
84
-
85
-
86
-
87
-
88
-
89
-
90
-
91
-
92
-
93
-
94
-
95
-
96
-
97
-
98
-
99
-
100
-
 101
101 -
 102
102 -
 103
103 -
 104
104 -
 105
105 -
 106
106 -
 107
107 -
 108
108 -
 109
109 -
 110
110 -
 111
111 -
 112
112 -
 113
113 -
 114
114 -
 115
115 -
 116
116 -
 117
117 -
 118
118 -
 119
119 -
 120
120 -
 121
121 -
122
-
123
-
124
-
125
-
126
-
127
-
128
 |
 |

109
SIA Annual Report 02/03
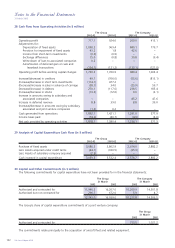
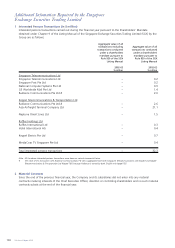
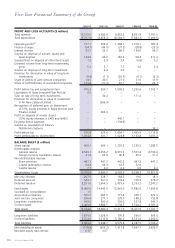
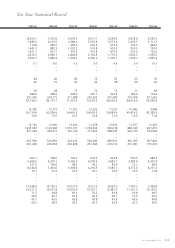
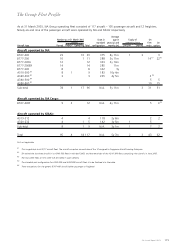
Half-Yearly Results of the Group
First half Second half Total
TOTAL REVENUE
2002-03 ($ million) 5,228.9 5,286.1 10,515.0
(%) 49.7 50.3 100.0
2001-02 ($ million) 4,731.6 4,651.2 9,382.8
(%) 50.4 49.6 100.0
TOTAL EXPENDITURE
2002-03 ($ million) 4,719.1 5,078.8 9,797.9
(%) 48.2 51.8 100.0
2001-02 ($ million) 4,279.6 4,178.6 8,458.2
(%) 50.6 49.4 100.0
OPERATING PROFIT R1
2002-03 ($ million) 509.8 207.3 717.1
(%) 71.1 28.9 100.0
2001-02 ($ million) 452.0 472.6 924.6
(%) 48.9 51.1 100.0
PROFIT BEFORE TAX
2002-03 ($ million) 656.4 320.4 976.8
(%) 67.2 32.8 100.0
2001-02 ($ million) 288.0 637.6 925.6
(%) 31.1 68.9 100.0
PROFIT ATTRIBUTABLE TO SHAREHOLDERS
2002-03 ($ million) 773.5 291.3 1,064.8
(%) 72.6 27.4 100.0
2001-02 ($ million) 134.8 496.9 631.7
(%) 21.3 78.7 100.0
EARNINGS (AFTER TAX) PER SHARE
2002-03 (cents) 63.5 23.9 87.4
(%) 72.7 27.3 100.0
2001-02 (cents) 11.1 40.8 51.9
(%) 21.4 78.6 100.0
R1 Operating profit was restated to exclude items such as interest income, dividends from long-term investments and provision for diminution in value of long-
term investments. Such items are now shown after operating profit. The change is to better reflect the performance of operating activities. Figures for the
previous year were adjusted to allow year-on-year comparisons.