Singapore Airlines 2003 Annual Report Download - page 114
Download and view the complete annual report
Please find page 114 of the 2003 Singapore Airlines annual report below. You can navigate through the pages in the report by either clicking on the pages listed below, or by using the keyword search tool below to find specific information within the annual report.-
 1
1 -
2
-
3
-
4
-
5
-
6
-
7
-
8
-
9
-
10
-
11
-
12
-
13
-
14
-
15
-
16
-
17
-
18
-
19
-
20
-
21
-
22
-
23
-
24
-
25
-
26
-
27
-
28
-
29
-
30
-
31
-
32
-
33
-
34
-
35
-
36
-
37
-
38
-
39
-
40
-
41
-
42
-
43
-
44
-
45
-
46
-
47
-
48
-
49
-
50
-
51
-
52
-
53
-
54
-
55
-
56
-
57
-
58
-
59
-
60
-
61
-
62
-
63
-
64
-
65
-
66
-
67
-
68
-
69
-
70
-
71
-
72
-
73
-
74
-
75
-
76
-
77
-
78
-
79
-
80
-
81
-
82
-
83
-
84
-
85
-
86
-
87
-
88
-
89
-
90
-
91
-
92
-
93
-
94
-
95
-
96
-
97
-
98
-
99
-
100
-
101
-
102
-
103
-
 104
104 -
 105
105 -
 106
106 -
 107
107 -
 108
108 -
 109
109 -
 110
110 -
 111
111 -
 112
112 -
 113
113 -
 114
114 -
 115
115 -
 116
116 -
 117
117 -
 118
118 -
 119
119 -
 120
120 -
 121
121 -
 122
122 -
 123
123 -
 124
124 -
125
-
126
-
127
-
128
 |
 |

2002-03 2001-02 2000-01
SIA PASSENGER COMPANY
FINANCIAL R1
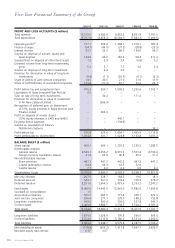
Total revenue ($ million) 8,047.0 7,694.7 9,125.8
Total expenditure ($ million) 7,838.0 7,281.6 8,222.5
Operating profit R2 ($ million) 209.0 413.1 903.3
Profit before tax ($ million) 460.1 740.7 1,607.2
Profit after tax ($ million) 618.0 567.2 1,422.2
Internally generated cash flow R3 ($ million) 2,503.5 1,986.1 2,968.2
Capital disbursements ($ million) 2,766.2 2,885.7 2,777.7
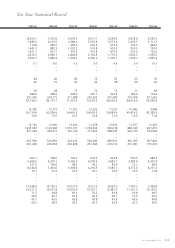
Passenger – yield (cts/pkm) 9.1 9.0 9.4
– unit cost (cts/ask) 6.7 6.4 –
– breakeven load factor (%) 73.6 71.1 –
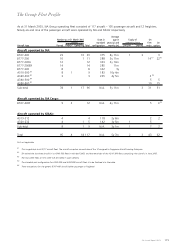
PASSENGER FLEET
Aircraft (number) 96 92 84
Average age (months) 71 69 70
PASSENGER PRODUCTION
Destination cities (number) 60 64 67
Distance flown (million km) 296.2 288.4 289.1
Time flown (hours) 384,652 368,204 366,784
Passenger capacity (million seat-km) 99,565.9 94,558.5 92,648.0
TRAFFIC
Passengers carried ('000) 15,326 14,765 15,002
Passengers carried (million pax-km) 74,183.2 69,994.5 71,118.4
Passenger load factor (%) 74.5 74.0 76.8
STAFF R1
Average strength 14,418 14,205 14,254
Overall capacity per employee (tonne-km) – – 1,265,189
Overall load carried per employee (tonne-km) – – 910,993
Seat capacity per employee R4 (seat-km) 6,905,667 6,656,705 –
Passenger load carried per employee R5 (tonne-km) 495,617 471,300 –
Revenue per employee ($) 558,122 541,690 647,516
Value added per employee ($) 191,566 189,806 284,369
SIA PASSENGER AND SIA CARGO COMPANY
Cargo and mail carried (million kg) 1,043.2 938.5 975.4
Cargo load (million tonne-km) 6,835.3 5,954.3 6,075.2
Mail load (million tonne-km) 78.3 85.5 92.4
Gross capacity (million tonne-km) 9,927.1 8,950.3 8,876.1
Cargo load factor (%) 69.6 67.5 69.5
Cargo yield (cts/ltk) 34.2 32.2 –
Cargo unit cost (cts/ctk) 23.9 23.2 –
Cargo breakeven load factor (%) 69.9 72.0 –
Overall load carried (million tonne-km) 14,059.5 12,734.6 12,985.3
Overall capacity (million tonne-km) 19,773.7 18,305.1 18,034.0
Overall load factor (%) 71.1 69.6 72.0
Overall yield (cts/ltk) 67.1 64.9 67.9
Overall unit cost (cts/ctk) 45.4 44.4 45.4
Overall breakeven load factor (%) 67.7 68.4 66.9
112 SIA Annual Report 02/03
Ten-Year Statistical Record
R1 SIA Cargo was corporatized on 1 July 2001. Statistics for 2000-01 and prior years show the combined results of both passenger and cargo operations.
R2 Operating profit was restated to better reflect the performance of operating activities. Non-operating items are now shown after operating profit.
Previous year’s figures have been adjusted to allow year-on-year comparisons.
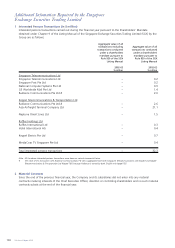
R3 Internally generated cash flow comprised cash generated from operations, dividends from subsidiaries and associated companies, and proceeds from
sale of aircraft and other fixed assets.
R4 Seat capacity per employee is available seat capacity divided by average staff strength of passenger operations.
R5 Passenger load carried per employee is defined as passenger load and excess baggage carried divided by average staff strength of passenger operations.