Singapore Airlines 2003 Annual Report Download - page 5
Download and view the complete annual report
Please find page 5 of the 2003 Singapore Airlines annual report below. You can navigate through the pages in the report by either clicking on the pages listed below, or by using the keyword search tool below to find specific information within the annual report.-
 1
1 -
 2
2 -
 3
3 -
 4
4 -
 5
5 -
 6
6 -
 7
7 -
 8
8 -
 9
9 -
 10
10 -
 11
11 -
 12
12 -
 13
13 -
 14
14 -
 15
15 -
 16
16 -
17
-
18
-
19
-
20
-
21
-
22
-
23
-
24
-
25
-
26
-
27
-
28
-
29
-
30
-
31
-
32
-
33
-
34
-
35
-
36
-
37
-
38
-
39
-
40
-
41
-
42
-
43
-
44
-
45
-
46
-
47
-
48
-
49
-
50
-
51
-
52
-
53
-
54
-
55
-
56
-
57
-
58
-
59
-
60
-
61
-
62
-
63
-
64
-
65
-
66
-
67
-
68
-
69
-
70
-
71
-
72
-
73
-
74
-
75
-
76
-
77
-
78
-
79
-
80
-
81
-
82
-
83
-
84
-
85
-
86
-
87
-
88
-
89
-
90
-
91
-
92
-
93
-
94
-
95
-
96
-
97
-
98
-
99
-
100
-
101
-
102
-
103
-
104
-
105
-
106
-
107
-
108
-
109
-
110
-
111
-
112
-
113
-
114
-
115
-
116
-
117
-
118
-
119
-
120
-
121
-
122
-
123
-
124
-
125
-
126
-
127
-
128
 |
 |

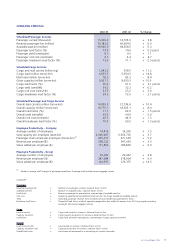
OPERATING STATISTICS
2002-03 2001-02 % Change
Scheduled Passenger Services
Passenger carried (thousand) 15,326.0 14,765.0 + 3.8
Revenue passenger-km (million) 74,183.2 69,994.5 + 6.0
Available seat-km (million) 99,565.9 94,558.5 + 5.3
Passenger load factor (%) 74.5 74.0 + 0.5 point
Passenger yield (cents/pkm) 9.1 9.0 + 1.1
Passenger unit cost (cents/ask) 6.7 6.4 + 4.7
Passenger breakeven load factor (%) 73.6 71.1 + 2.5 points
Scheduled Cargo Services
Cargo and mail carried (million kg) 1,043.2 938.5 + 11.2
Cargo load (million tonne-km) 6,835.3 5,954.3 + 14.8
Mail load (million tonne-km) 78.3 85.5 – 8.4
Gross capacity (million tonne-km) 9,927.1 8,950.3 + 10.9
Cargo load factor (%) 69.6 67.5 + 2.1 points
Cargo yield (cents/ltk) 34.2 32.2 + 6.2
Cargo unit cost (cents/ctk) 23.9 23.2 + 3.0
Cargo breakeven load factor (%) 69.9 72.0 – 2.1 points
Scheduled Passenger and Cargo Services
Overall load carried (million tonne-km) 14,059.5 12,734.6 + 10.4
Overall capacity (million tonne-km) 19,773.7 18,305.1 + 8.0
Overall load factor (%) 71.1 69.6 + 1.5 points
Overall yield (cents/ltk) 64.5 64.9 – 0.6
Overall unit cost (cents/ctk) 45.5 44.9 + 1.3
Overall breakeven load factor (%) 70.5 69.2 + 1.3 points
Employee Productivity – Company
Average number of employees 14,418 14,205 + 1.5
Seat capacity per employee (seat-km) 6,905,667 6,656,705 + 3.7
Passenger load carried per employee (tonne-km) R1 495,617 471,300 + 5.2
Revenue per employee ($) 558,122 541,690 + 3.0
Value added per employee ($) 191,566 189,806 + 0.9
Employee Productivity – Group
Average number of employees 30,243 29,422 + 2.8
Revenue per employee ($) 347,684 318,904 + 9.0
Value added per employee ($) 144,397 126,375 + 14.3
R1 Based on average staff strength of passenger operations. Passenger load includes excess baggage carried.
GLOSSARY
Passenger
Revenue passenger-km = Number of passengers carried x distance flown (in km)
Available seat-km = Number of available seats x distance flown (in km)
Load factor = Revenue passenger-km expressed as a percentage of available seat-km
Unit cost = Operating expenditure less bellyhold revenue from SIA Cargo divided by available seat-km
Yield = Operating passenger revenue from scheduled services divided by passenger-km flown
Breakeven load factor = Theoretical load factor at which operating expenditure less bellyhold revenue from SIA Cargo equals operating
passenger and excess baggage revenue
Cargo
Load tonne-km = Cargo load carried (in tonnes) x distance flown (in km)
Capacity tonne-km = Cargo capacity production (in tonnes) x distance flown (in km)
Load factor = Cargo load tonne-km expressed as a percentage of cargo capacity tonne-km
Overall
Load tonne-km (ltk) = Load carried (in tonnes) x distance flown (in km)
Capacity tonne-km (ctk) = Capacity production (in tonnes) x distance flown (in km)
Overall load factor = Load tonne-km expressed as a percentage of capacity tonne-km
3
SIA Annual Report 02/03