Singapore Airlines 2003 Annual Report Download - page 108
Download and view the complete annual report
Please find page 108 of the 2003 Singapore Airlines annual report below. You can navigate through the pages in the report by either clicking on the pages listed below, or by using the keyword search tool below to find specific information within the annual report.-
 1
1 -
2
-
3
-
4
-
5
-
6
-
7
-
8
-
9
-
10
-
11
-
12
-
13
-
14
-
15
-
16
-
17
-
18
-
19
-
20
-
21
-
22
-
23
-
24
-
25
-
26
-
27
-
28
-
29
-
30
-
31
-
32
-
33
-
34
-
35
-
36
-
37
-
38
-
39
-
40
-
41
-
42
-
43
-
44
-
45
-
46
-
47
-
48
-
49
-
50
-
51
-
52
-
53
-
54
-
55
-
56
-
57
-
58
-
59
-
60
-
61
-
62
-
63
-
64
-
65
-
66
-
67
-
68
-
69
-
70
-
71
-
72
-
73
-
74
-
75
-
76
-
77
-
78
-
79
-
80
-
81
-
82
-
83
-
84
-
85
-
86
-
87
-
88
-
89
-
90
-
91
-
92
-
93
-
94
-
95
-
96
-
97
-
 98
98 -
 99
99 -
 100
100 -
 101
101 -
 102
102 -
 103
103 -
 104
104 -
 105
105 -
 106
106 -
 107
107 -
 108
108 -
 109
109 -
 110
110 -
 111
111 -
 112
112 -
 113
113 -
 114
114 -
 115
115 -
 116
116 -
 117
117 -
 118
118 -
119
-
120
-
121
-
122
-
123
-
124
-
125
-
126
-
127
-
128
 |
 |
106 SIA Annual Report 02/03
Notes to the Financial Statements
31 March 2003
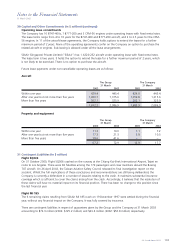
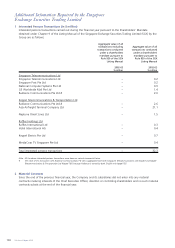
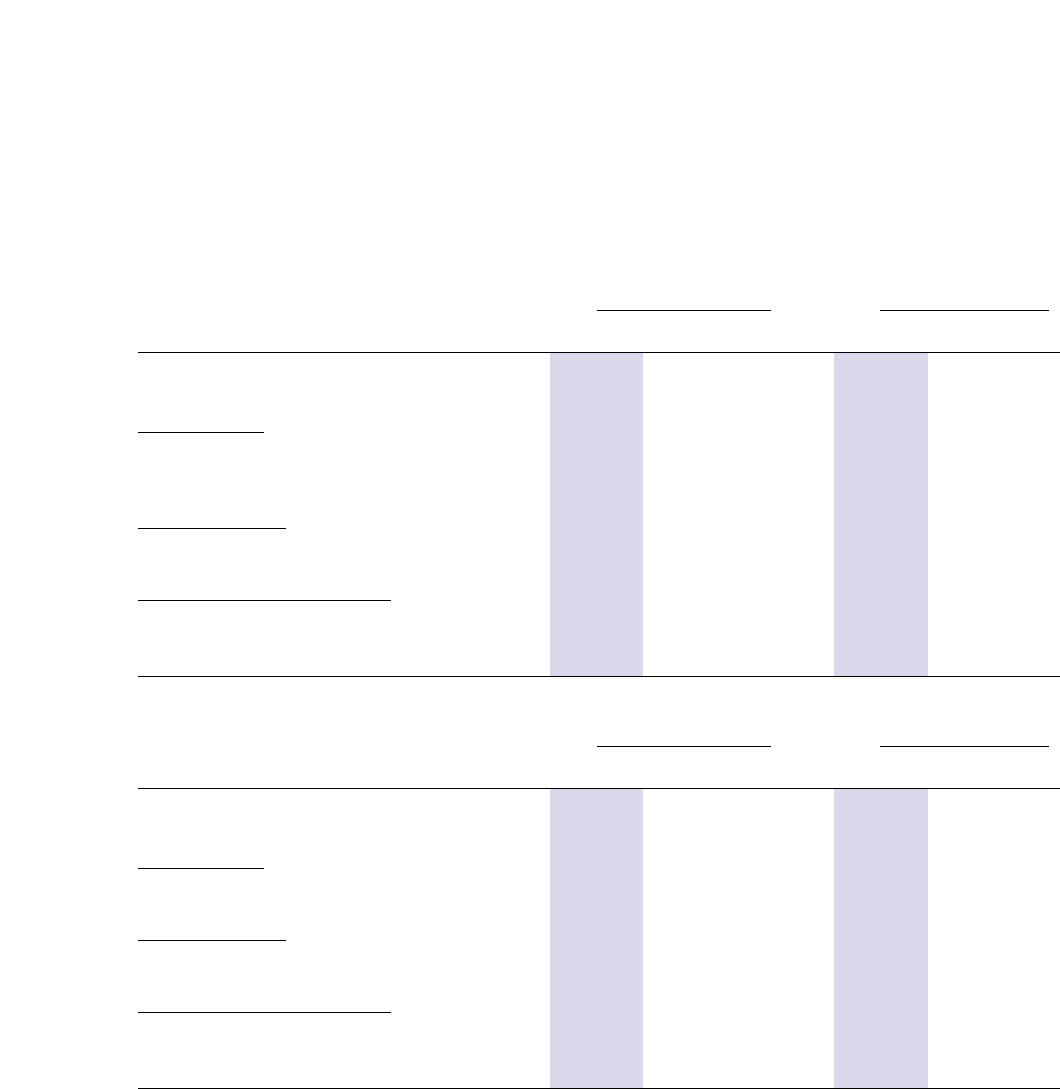
32 Financial Instruments (in $ million) (continued)
(i) Net fair values
The aggregate net fair values of financial assets and financial liabilities which are not carried at fair value on the
Group and Company balance sheets are presented as follows:
Total carrying amount Aggregate net
on Balance Sheet fair value
31 March 31 March
2003 2002 2003 2002
Group
Financial Assets
Long-term investments 569.6 590.4 637.8 631.1
Short-term investments 148.3 34.2 148.4 37.4
Financial Liabilities
Notes payable 1,100.0 1,100.0 1,197.8 1,086.2
Derivative financial instruments
Foreign currency contracts * * (31.1) (3.4)
Jet fuel swap contracts * * 9.2 17.6
Jet fuel options contracts * * (11.5) 0.2
Total carrying amount Aggregate net
on Balance Sheet fair value
31 March 31 March
2003 2002 2003 2002
Company
Financial Assets
Long-term investments 489.4 502.9 557.6 543.6
Financial Liabilities
Notes payable 900.0 900.0 994.5 884.9
Derivative financial instruments
Foreign currency contracts * * (31.1) (3.4)
Jet fuel swap contracts * * 7.6 14.4
Jet fuel options contracts * * (9.4) 0.2
* No balance sheet carrying amounts are shown as these are commitments as at year end.
The fair value of quoted investments is generally determined by reference to stock exchange quoted market bid
prices at the close of the business on the balance sheet date. For investments where there is no quoted market
price, fair value is based on either acquisition cost or the attributable net assets of those corporations.
The fair value of loans and borrowings is estimated using discounted cash flow analysis, based on current
incremental lending rates for similar types of lending and borrowing arrangements.
The fair value of forward currency contracts is determined by reference to current forward exchange rates for
contracts with similar maturity profiles. The fair value of jet fuel swap and option contracts is determined by
reference to current forward prices for contracts with similar maturity profiles.
The carrying amounts of the following financial assets and liabilities approximate their fair values due to their
short-term nature: cash and bank balances, bank overdrafts – unsecured, amounts owing by/to subsidiary,
associated and joint venture companies, loans, finance lease commitments, trade debtors and creditors.