Singapore Airlines 2003 Annual Report Download - page 103
Download and view the complete annual report
Please find page 103 of the 2003 Singapore Airlines annual report below. You can navigate through the pages in the report by either clicking on the pages listed below, or by using the keyword search tool below to find specific information within the annual report.-
 1
1 -
2
-
3
-
4
-
5
-
6
-
7
-
8
-
9
-
10
-
11
-
12
-
13
-
14
-
15
-
16
-
17
-
18
-
19
-
20
-
21
-
22
-
23
-
24
-
25
-
26
-
27
-
28
-
29
-
30
-
31
-
32
-
33
-
34
-
35
-
36
-
37
-
38
-
39
-
40
-
41
-
42
-
43
-
44
-
45
-
46
-
47
-
48
-
49
-
50
-
51
-
52
-
53
-
54
-
55
-
56
-
57
-
58
-
59
-
60
-
61
-
62
-
63
-
64
-
65
-
66
-
67
-
68
-
69
-
70
-
71
-
72
-
73
-
74
-
75
-
76
-
77
-
78
-
79
-
80
-
81
-
82
-
83
-
84
-
85
-
86
-
87
-
88
-
89
-
90
-
91
-
92
-
 93
93 -
 94
94 -
 95
95 -
 96
96 -
 97
97 -
 98
98 -
 99
99 -
 100
100 -
 101
101 -
 102
102 -
 103
103 -
 104
104 -
 105
105 -
 106
106 -
 107
107 -
 108
108 -
 109
109 -
 110
110 -
 111
111 -
 112
112 -
 113
113 -
114
-
115
-
116
-
117
-
118
-
119
-
120
-
121
-
122
-
123
-
124
-
125
-
126
-
127
-
128
 |
 |

101
SIA Annual Report 02/03
Notes to the Financial Statements
31 March 2003
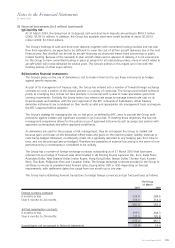
26 Investments (in $ million)
The Group The Company
31 March 31 March
2003 2002 2003 2002
Quoted investments at cost
Government securities 2.8 2.4 – –
Equity investments 16.4 18.9 – –
Non-equity investments 14.1 13.6 – –
33.3 34.9 – –
Unquoted investments at cost
Non-equity investments 117.8 – – –
151.1 34.9 – –
Provision for diminution
Equity investments (2.1) – – –
Non-equity investments, quoted (0.7) (0.7) – –
(2.8) (0.7) – –
148.3 34.2 – –
Market value of quoted investments
Government securities 2.8 2.4 – –
Equity investments 14.3 21.9 – –
Non-equity investments 13.5 13.1 – –
30.6 37.4 – –
The Group The Company
31 March 31 March
2003 2002 2003 2002
Analysis of provision for diminution in value
of quoted investments
Balance at 1 April 0.7 1.8 – –
Provided/(written-back) during the year 2.1 (1.1) – –
Balance at 31 March 2.8 0.7 – –
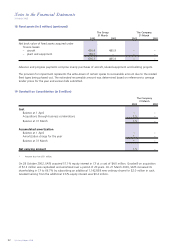
27 Cash and Bank Balances (in $ million)
The Group The Company
31 March 31 March
2003 2002 2003 2002
Fixed deposits 528.2 531.5 306.2 438.0
Cash and bank 291.7 560.1 122.5 416.9
819.9 1,091.6 428.7 854.9