Xerox 2009 Annual Report Download - page 92
Download and view the complete annual report
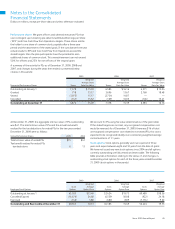
Please find page 92 of the 2009 Xerox annual report below. You can navigate through the pages in the report by either clicking on the pages listed below, or by using the keyword search tool below to find specific information within the annual report.-
 1
1 -
2
-
3
-
4
-
5
-
6
-
7
-
8
-
9
-
10
-
11
-
12
-
13
-
14
-
15
-
16
-
17
-
18
-
19
-
20
-
21
-
22
-
23
-
24
-
25
-
26
-
27
-
28
-
29
-
30
-
31
-
32
-
33
-
34
-
35
-
36
-
37
-
38
-
39
-
40
-
41
-
42
-
43
-
44
-
45
-
46
-
47
-
48
-
49
-
50
-
51
-
52
-
53
-
54
-
55
-
56
-
57
-
58
-
59
-
60
-
61
-
62
-
63
-
64
-
65
-
66
-
67
-
68
-
69
-
70
-
71
-
72
-
73
-
74
-
75
-
76
-
77
-
78
-
79
-
80
-
81
-
 82
82 -
 83
83 -
 84
84 -
 85
85 -
 86
86 -
 87
87 -
 88
88 -
 89
89 -
 90
90 -
 91
91 -
 92
92 -
 93
93 -
 94
94 -
 95
95 -
 96
96
 |
 |
90
Five Years in Review
(in millions, except per-share data)
2009 2008 2007(2) 2006 2005
Per-Share Data
Income from continuing operations
Basic $ 0.56 $ 0.26 $ 1.21 $ 1.25 $ 0.91
Diluted 0.55 0.26 1.19 1.22 0.90
Earnings
Basic $ 0.56 $ 0.26 $ 1.21 $ 1.25 $ 0.96
Diluted 0.55 0.26 1.19 1.22 0.94
Common stock dividends declared $ 0.17 $ 0.17 $ 0.0425 $ — $ —
Operations
Revenues $ 15,179 $ 17,608 $ 17,228 $ 15,895 $ 15,701
Sales 6,646 8,325 8,192 7,464 7,400
Service, outsourcing and rentals 7,820 8,485 8,214 7,591 7,426
Finance income 713 798 822 840 875
Income from continuing operations 516 265 1,165 1,232 948
Income from continuing operations – Xerox 485 230 1,135 1,210 933
Net income 516 265 1,165 1,232 993
Net income – Xerox 485 230 1,135 1,210 978
Financial Position
Working capital $ 5,270 $ 2,700 $ 4,463 $ 4,056 $ 4,390
Total assets 24,032 22,447 23,543 21,709 21,953
Consolidated Capitalization
Short-term debt and current portion of long-term debt $ 988 $ 1,610 $ 525 $ 1,485 $ 1,139
Long-term debt 8,276 6,774 6,939 5,660 6,139
Total Debt 9,264 8,384 7,464 7,145 7,278
Liabilities to subsidiary trusts issuing preferred securities(1) 649 648 632 624 724
Series C mandatory convertible preferred stock — — — — 889
Xerox shareholders’ equity 7,050 6,238 8,588 7,080 6,319
Noncontrolling interests 141 120 103 108 90
Total Consolidated Capitalization $ 17,104 $ 15,390 $ 16,787 $ 14,957 $ 15,300
Selected Data and Ratios
Common shareholders of record at year-end 44,792 46,541 48,261 40,372 53,017
Book value per common share $ 8.11 $ 7.21 $ 9.36 $ 7.48 $ 6.79
Year-end common stock market price $ 8.46 $ 7.97 $ 16.19 $ 16.95 $ 14.65
Employees at year-end 53,600 57,100 57,400 53,700 55,220
Gross margin 39.7% 38.9% 40.3% 40.6% 41.2%
Sales gross margin 33.9% 33.7% 35.9% 35.7% 36.6%
Service, outsourcing and rentals gross margin 42.6% 41.9% 42.7% 43.0% 43.3%
Finance gross margin 62.0% 61.8% 61.6% 63.7% 62.7%
(1) For 2005, the amount includes $98 reported in other current liabilities.
(2) 2007 results include the acquisition of GIS.