Xerox 2009 Annual Report Download - page 59
Download and view the complete annual report
Please find page 59 of the 2009 Xerox annual report below. You can navigate through the pages in the report by either clicking on the pages listed below, or by using the keyword search tool below to find specific information within the annual report.-
 1
1 -
2
-
3
-
4
-
5
-
6
-
7
-
8
-
9
-
10
-
11
-
12
-
13
-
14
-
15
-
16
-
17
-
18
-
19
-
20
-
21
-
22
-
23
-
24
-
25
-
26
-
27
-
28
-
29
-
30
-
31
-
32
-
33
-
34
-
35
-
36
-
37
-
38
-
39
-
40
-
41
-
42
-
43
-
44
-
45
-
46
-
47
-
48
-
 49
49 -
 50
50 -
 51
51 -
 52
52 -
 53
53 -
 54
54 -
 55
55 -
 56
56 -
 57
57 -
 58
58 -
 59
59 -
 60
60 -
 61
61 -
 62
62 -
 63
63 -
 64
64 -
 65
65 -
 66
66 -
 67
67 -
 68
68 -
 69
69 -
70
-
71
-
72
-
73
-
74
-
75
-
76
-
77
-
78
-
79
-
80
-
81
-
82
-
83
-
84
-
85
-
86
-
87
-
88
-
89
-
90
-
91
-
92
-
93
-
94
-
95
-
96
 |
 |

57Xerox 2009 Annual Report
Notes to the Consolidated
Financial Statements
Dollars in millions, except per-share data and unless otherwise indicated.
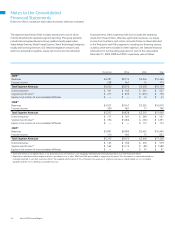
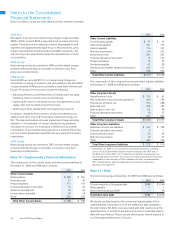
Note 5 – Inventories and Equipment on
Operating Leases, Net
Inventories at December 31, 2009 and 2008 were as follows:
2009 2008
Finished goods $ 772 $ 1,044
Work-in-process 43 80
Raw materials 85 108
Total Inventories $ 900 $ 1,232
Cost of sales in 2008 included a charge of $39 associated with an
Office segment product line equipment and residual value write-off.
The write-off was the result of a 2008 change in strategy reflecting our
decision to discontinue the remanufacture of end-of-lease returned
inventory from a certain Office segment product line following an
assessment of the current and expected market for these products.
The transfer of equipment from our inventories to equipment subject
to an operating lease is presented in our Consolidated Statements of
Cash Flows in the operating activities section as a non-cash adjustment.
Equipment on operating leases and similar arrangements consists of our
equipment rented to customers and depreciated to estimated salvage
value at the end of the lease term. We recorded $52, $115 and $66 in
inventory write-down charges for the years ended December 31, 2009,
2008 and 2007, respectively.
Equipment on operating leases and the related accumulated
depreciation at December 31, 2009 and 2008 were as follows:
2009 2008
Equipment on operating leases $ 1,583 $ 1,507
Accumulated depreciation (1,032) (913)
Equipment on Operating Leases, Net $ 551 $ 594
Depreciable lives generally vary from three to four years, consistent
with our planned and historical usage of the equipment subject to
operating leases. Depreciation and obsolescence expense for equipment
on oper ating leases was $329, $298 and $269 for the years ended
December 31, 2009, 2008 and 2007, respectively. Our equipment
operating lease terms vary, generally from 12 to 36 months. Scheduled
minimum future rental revenues on operating leases with original
terms of one year or longer are:
2010 2011 2012 2013 2014 Thereafter
$385 $281 $181 $94 $46 $45
Total contingent rentals on operating leases, consisting principally of
usage charges in excess of minimum contracted amounts, for the years
ended December 31, 2009, 2008 and 2007 amounted to $125, $117
and $117, respectively.
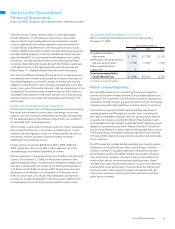
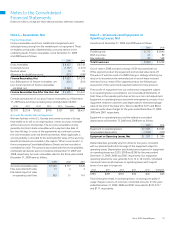
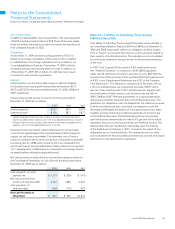
Note 4 – Receivables, Net
Finance Receivables
Finance receivables result from installment arrangements and
sales-type leases arising from the marketing of our equipment. These
receivables are typically collateralized by a security interest in the
underlying assets. Finance receivables, net at December 31, 2009
and 2008 were as follows:
2009 2008
Gross receivables $ 8,427 $ 8,718
Unearned income (1,197) (1,273)
Residual values 19 31
Allowance for doubtful accounts (222) (198)
Finance Receivables, Net $ 7,027 $ 7,278
Less: Billed portion of finance receivables, net (226) (254)
Less: Current portion of finance receivables
not billed, net (2,396) (2,461)
Finance Receivables Due After One Year, Net $ 4,405 $ 4,563
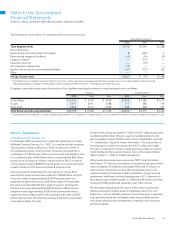
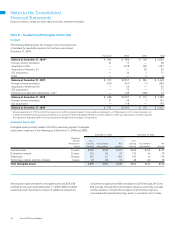
Contractual maturities of our gross finance receivables as of December
31, 2009 were as follows (including those already billed of $226):
2010 2011 2012 2013 2014 Thereafter Total
$3,191 $2,334 $1,622 $910 $327 $43 $8,427
Accounts Receivable Sales Arrangements
We have facilities in the U.S., Canada and several countries in Europe
that enable us to sell, on an ongoing basis, certain accounts receivable
without recourse to third parties. The accounts receivables sold are
generally short-term trade receivables with a payment due date of
less than 60 days. In some of the agreements we continue to service
the sold receivables and hold beneficial interests. When applicable, a
servicing liability is recorded for the estimated fair value of the servicing.
Beneficial interests are included in the caption “Other current assets” in
the accompanying Consolidated Balance Sheets and are recorded at
estimated fair value. The amounts associated with the servicing liability
and beneficial interests were not material at December 31, 2009 and
2008, respectively. Accounts receivables sales for the three years ended
December 31, 2009 were as follows:
2009 2008 2007
Accounts receivables sales $ 1,566 $ 717 $ 326
Fees associated with sales 13 4 2
Estimated impact of sales
on operating cash flows 309 51 147