Xerox 2009 Annual Report Download - page 33
Download and view the complete annual report
Please find page 33 of the 2009 Xerox annual report below. You can navigate through the pages in the report by either clicking on the pages listed below, or by using the keyword search tool below to find specific information within the annual report.-
 1
1 -
2
-
3
-
4
-
5
-
6
-
7
-
8
-
9
-
10
-
11
-
12
-
13
-
14
-
15
-
16
-
17
-
18
-
19
-
20
-
21
-
22
-
 23
23 -
 24
24 -
 25
25 -
 26
26 -
 27
27 -
 28
28 -
 29
29 -
 30
30 -
 31
31 -
 32
32 -
 33
33 -
 34
34 -
 35
35 -
 36
36 -
 37
37 -
 38
38 -
 39
39 -
 40
40 -
 41
41 -
 42
42 -
 43
43 -
44
-
45
-
46
-
47
-
48
-
49
-
50
-
51
-
52
-
53
-
54
-
55
-
56
-
57
-
58
-
59
-
60
-
61
-
62
-
63
-
64
-
65
-
66
-
67
-
68
-
69
-
70
-
71
-
72
-
73
-
74
-
75
-
76
-
77
-
78
-
79
-
80
-
81
-
82
-
83
-
84
-
85
-
86
-
87
-
88
-
89
-
90
-
91
-
92
-
93
-
94
-
95
-
96
 |
 |

31Xerox 2009 Annual Report
Management’s Discussion
•Sales gross margin decreased 2.2-percentage points primarily due to
the approximately 2.5-percentage point impact of price declines, as
well as channel and product mix. Cost improvements, which historically
tend to offset price declines, were limited in 2008 by the adverse
impact of the strengthening Yen on our inventory purchases.
•Service, outsourcing and rentals margin decreased 0.8-percentage
points, primarily due to mix, as price declines of 1.3-percentage points
were offset by cost improvements. Mix reflects margin pressure from
document management services.
•Financing income margin of approximately 62% remained
comparable to 2007.
•Since a large portion of our inventory procurement is from Japan,
the strengthening of the Yen versus the U.S. Dollar and Euro in
2008 significantly impacted our product cost. The Yen strengthened
approximately 14% against the U.S. Dollar and 6% against the
Euro in 2008 as compared to 2007. A significant portion of that
strengthening occurred in the fourth quarter 2008 when the Yen
strengthened 17% against the U.S. Dollar and 29% against the
Euro as compared to prior year.
Research, Development and Engineering Expenses (“RD&E”)
We invest in technological development, particularly in color, and believe
our RD&E spending is sufficient to remain technologically competitive.
Our R&D is strategically coordinated with that of Fuji Xerox.
RD&E2008
The decrease in R&D spending for 2008 reflects the capture of
efficiencies following a significant number of new product launches
over the previous two years, as well as leveraging our current RD&E
investments to support our GIS operations. Sustaining engineering
costs declined in 2008 due primarily to lower spending related to
environmental compliance activities and maturing product platforms
in the Production segment.
•Sales gross margin increased 0.2-percentage points, primarily
due to the cost improvements and the positive mix of revenues
partially offset by the adverse impact of transaction currency on
our inventory purchases of 1.0-percentage point and price declines
of 1.2-percentage points.
•Service, outsourcing and rentals margin increased 0.7-percentage
points, primarily due to the positive impact from the reduction in
costs driven by our restructuring and cost actions of 1.5-percentage
points. These cost improvements more than offset the approximate
0.9-percentage points impact of pricing.
•Financing income margin of 62% remained comparable to 2008.
GrossMargin2008
2008 Total gross margin decreased 1.4-percentage points compared
to 2007, as price declines and mix of approximately 2.0-percentage
points were only partially offset by cost productivity improvements. Cost
improvements were limited by an unfavorable impact on product costs of
approximately 0.5-percentage points from the significant strengthening
of the Yen versus the U.S. Dollar and Euro. The negative impact of
0.3-percentage points from an Office product line equipment write-off
was offset by positive adjustments related to the capitalized costs for
equipment on operating leases and European product disposal costs.
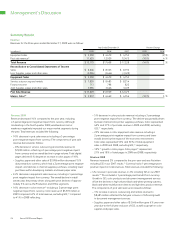
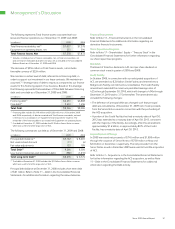
RD&E2009
The decrease in RD&E spending for 2009 reflects our restructuring
and cost actions which consolidated the Production and Office
development and engineering infrastructures.
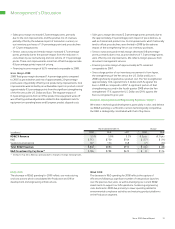
Year Ended December 31, Change
(in millions) 2009 2008 2007 2009 2008
RD&E % Revenue 5.5% 5.0% 5.3% 0.5 pts (0.3) pts
R&D $ 713 $ 750 $ 764 $ (37) $ (14)
Sustaining engineering 127 134 148 (7) (14)
Total RD&E Expenses $ 840 $ 884 $ 912 $ (44) $ (28)
R&D Investment by Fuji Xerox(1) $ 796 $ 788 $ 672 $ 8 $ 116
(1) Increase in Fuji Xerox R&D was primarily due to changes in foreign exchange rates.