Xerox 2009 Annual Report Download - page 64
Download and view the complete annual report
Please find page 64 of the 2009 Xerox annual report below. You can navigate through the pages in the report by either clicking on the pages listed below, or by using the keyword search tool below to find specific information within the annual report.-
 1
1 -
2
-
3
-
4
-
5
-
6
-
7
-
8
-
9
-
10
-
11
-
12
-
13
-
14
-
15
-
16
-
17
-
18
-
19
-
20
-
21
-
22
-
23
-
24
-
25
-
26
-
27
-
28
-
29
-
30
-
31
-
32
-
33
-
34
-
35
-
36
-
37
-
38
-
39
-
40
-
41
-
42
-
43
-
44
-
45
-
46
-
47
-
48
-
49
-
50
-
51
-
52
-
53
-
 54
54 -
 55
55 -
 56
56 -
 57
57 -
 58
58 -
 59
59 -
 60
60 -
 61
61 -
 62
62 -
 63
63 -
 64
64 -
 65
65 -
 66
66 -
 67
67 -
 68
68 -
 69
69 -
 70
70 -
 71
71 -
 72
72 -
 73
73 -
 74
74 -
75
-
76
-
77
-
78
-
79
-
80
-
81
-
82
-
83
-
84
-
85
-
86
-
87
-
88
-
89
-
90
-
91
-
92
-
93
-
94
-
95
-
96
 |
 |
62 Xerox 2009 Annual Report
Notes to the Consolidated
Financial Statements
Dollars in millions, except per-share data and unless otherwise indicated.
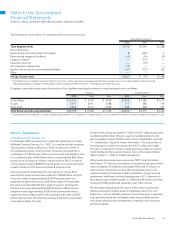
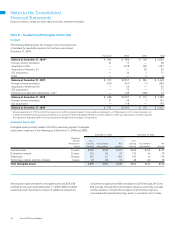
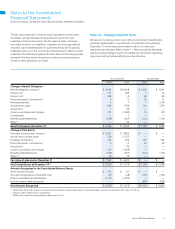
2009 2008
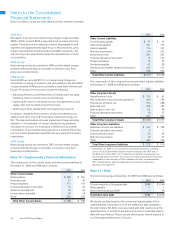
Other Current Liabilities
Income taxes payable $ 27 $ 47
Other taxes payable 161 173
Interest payable 114 141
Restructuring reserves 64 325
Unearned income 201 203
Financial derivative instruments 15 134
Product warranties 19 25
Dividends payable 41 38
Distributor and reseller rebates/commissions 127 131
Other 558 552
Total Other Current Liabilities $ 1,327 $ 1,769
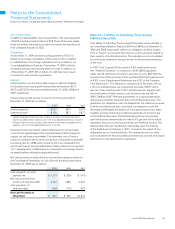
The components of other long-term assets and other long-term liabilities
at December 31, 2009 and 2008 were as follows:
2009 2008
Other Long-term Assets
Prepaid pension costs $ 155 $ 61
Net investment in discontinued operations(1) 240 259
Internal use software, net 354 288
Restricted cash 258 183
Debt issuance costs, net 62 48
Financial derivative instruments 10 53
Other 241 265
Total Other Long-term Assets $ 1,320 $ 1,157
Other Long-term Liabilities
Deferred and other tax liabilities $ 167 $ 182
Financial derivative instruments 9 —
Environmental reserves 23 29
Restructuring reserves 10 27
Other 363 336
Total Other Long-term Liabilities $ 572 $ 574
(1) At December 31, 2009, our net investment in discontinued operations primarily
consists of a $265 performance-based instrument relating to the 1997 sale of
The Resolution Group (“TRG”), net of remaining net liabilities associated with our
discontinued operations of $25. The recovery of the performance-based instrument
is dependent on the sufficiency of TRG’s available cash flows, as guaranteed by
TRG’s ultimate parent, which are expected to be recovered in annual cash
distributions through 2017.
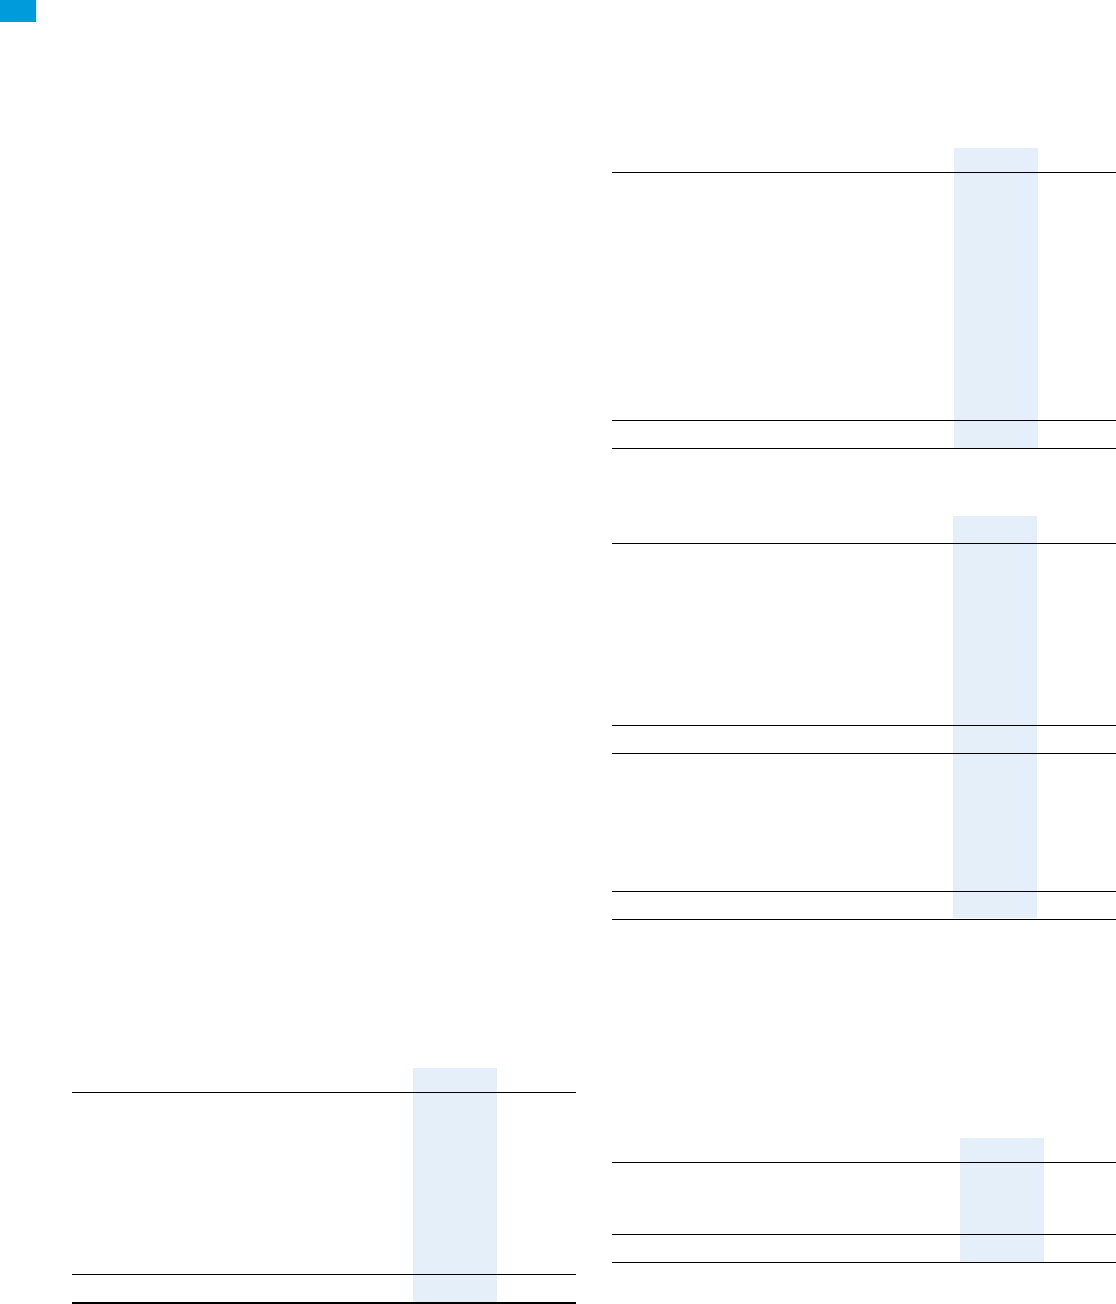
Note 11 – Debt
Short-term borrowings at December 31, 2009 and 2008 were as follows:
2009 2008
Current maturities of long-term debt $ 988 $ 1,549
Notes payable — 7
Italy Credit Facility due 2009 — 54
Total Short-term Debt $ 988 $ 1,610
We classify our debt based on the contractual maturity dates of the
underlying debt instruments or as of the earliest put date available to
the debt holders. We defer costs associated with debt issuance over the
applicable term, or to the first put date in the case of convertible debt or
debt with a put feature. These costs are amortized as interest expense in
our Consolidated Statements of Income.
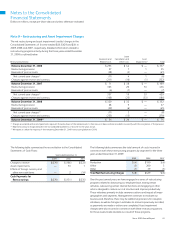
2010 Plan
We expect to record pre-tax restructuring charges of approximately
$280 in 2010, of which $250 is expected to be recorded in the first
quarter. These actions are expected to impact all geographies and
segments with approximately equal focus on SAG reductions, gross
margin improvements and optimization of RD&E investments. The
restructuring is also expected to involve the rationalization of some
of our facilities.
2009 Activity
Restructuring activity was minimal in 2009 and the related charges
primarily reflected changes in estimates in severance costs from
previously recorded actions.
2008 Activity
During 2008, we recorded $357 of net restructuring charges pre-
dominantly consisting of severance and costs related to the elimination
of approximately 4,900 positions, primarily in both North America and
Europe. Focus areas for the actions include the following:
•Improving efficiency and effectiveness of infrastructure including:
marketing, finance, human resources and training.
•Capturing efficiencies in technical services, managed services, and
supply chain and manufacturing infrastructure.
•Optimizing product development and engineering resources.
In addition, related to these activities, we also recorded lease can-
cellation and other costs of $19 and asset impairment charges of
$53. The lease termination and asset impairment charges primarily
related to: (i) the relocation of certain manufacturing operations
including the closing of our toner plant in Oklahoma City and the
consolidation of our manufacturing operations in Ireland; and (ii) the
exit from certain leased and owned facilities as a result of the actions
noted above.
2007 Activity
Restructuring activity was minimal in 2007 and the related charges
primarily reflected changes in estimates in severance costs from
previously recorded actions.
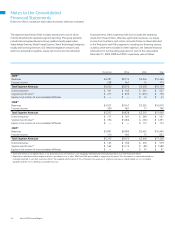
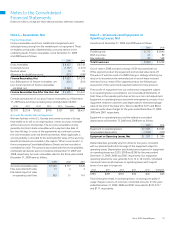
Note 10 – Supplementary Financial Information
The components of other current assets and other current liabilities at
December 31, 2009 and 2008 were as follows:
2009 2008
Other Current Assets
Deferred taxes $ 290 $ 305
Restricted cash 31 20
Prepaid expenses 111 119
Financial derivative instruments 16 39
Advances and deposits 19 26
Income taxes receivable 38 42
Other 203 239
Total Other Current Assets $ 708 $ 790