Xerox 2009 Annual Report Download - page 79
Download and view the complete annual report
Please find page 79 of the 2009 Xerox annual report below. You can navigate through the pages in the report by either clicking on the pages listed below, or by using the keyword search tool below to find specific information within the annual report.-
 1
1 -
2
-
3
-
4
-
5
-
6
-
7
-
8
-
9
-
10
-
11
-
12
-
13
-
14
-
15
-
16
-
17
-
18
-
19
-
20
-
21
-
22
-
23
-
24
-
25
-
26
-
27
-
28
-
29
-
30
-
31
-
32
-
33
-
34
-
35
-
36
-
37
-
38
-
39
-
40
-
41
-
42
-
43
-
44
-
45
-
46
-
47
-
48
-
49
-
50
-
51
-
52
-
53
-
54
-
55
-
56
-
57
-
58
-
59
-
60
-
61
-
62
-
63
-
64
-
65
-
66
-
67
-
68
-
 69
69 -
 70
70 -
 71
71 -
 72
72 -
 73
73 -
 74
74 -
 75
75 -
 76
76 -
 77
77 -
 78
78 -
 79
79 -
 80
80 -
 81
81 -
 82
82 -
 83
83 -
 84
84 -
 85
85 -
 86
86 -
 87
87 -
 88
88 -
 89
89 -
90
-
91
-
92
-
93
-
94
-
95
-
96
 |
 |
77Xerox 2009 Annual Report
Notes to the Consolidated
Financial Statements
Dollars in millions, except per-share data and unless otherwise indicated.
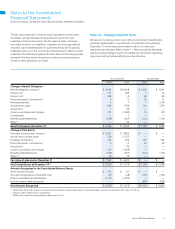
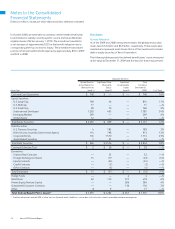
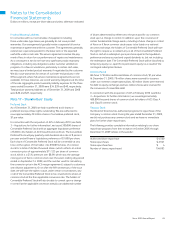
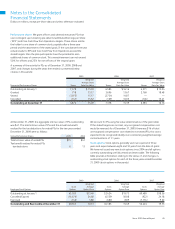
Note 15 – Income and Other Taxes
Income (loss) before income taxes for the three years ended
December 31, 2009 was as follows:
2009 2008 2007
Domestic income (loss) $ 45 $ (622) $ 691
Foreign income 582 543 777
Income (Loss) Before
Income Taxes $ 627 $ (79) $1,468
Provisions (benefits) for income taxes for the three years ended
December 31, 2009 were as follows:
2009 2008 2007
Federal income taxes
Current $ (50) $ (26) $ 30
Deferred 109 (285) 92
Foreign income taxes
Current 84 118 144
Deferred 11 4 120
State income taxes
Current (2) 1 2
Deferred — (43) 12
Total Provision (Benefits) $ 152 $ (231) $ 400
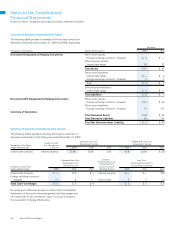
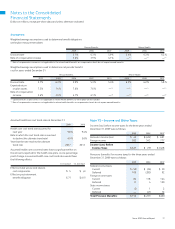
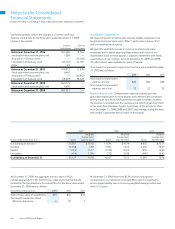
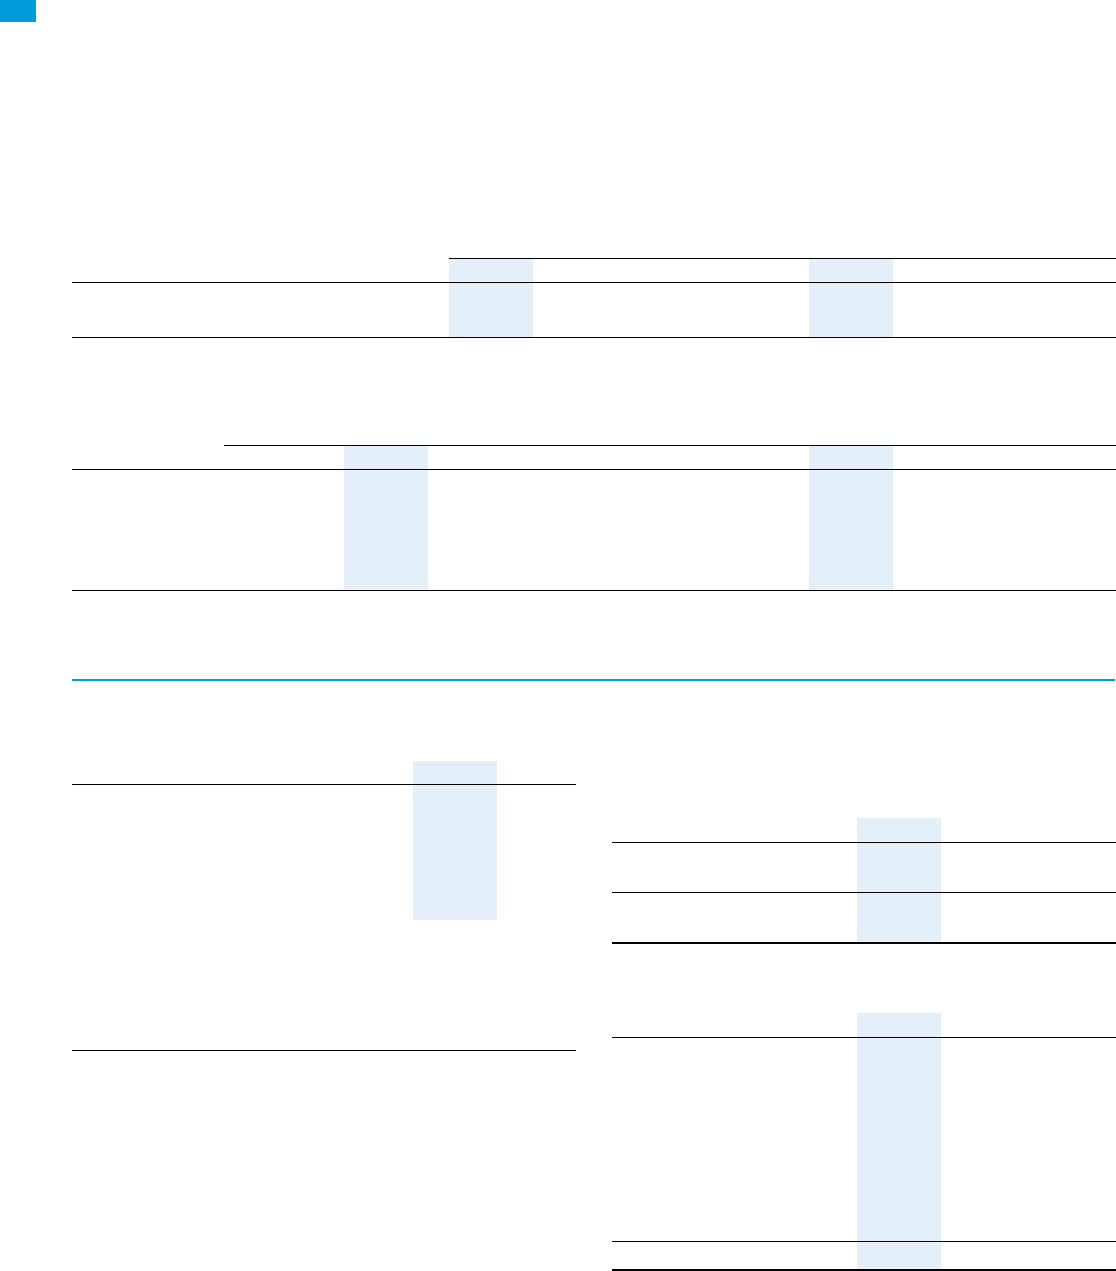
Assumptions
Weighted-average assumptions used to determine benefit obligations
at the plan measurement dates:
Pension Benefits Retiree Health
2009 2008 2007 2009 2008 2007
Discount rate 5.7% 6.3% 5.9% 5.4% 6.3% 6.2%
Rate of compens
ation increase
3.6% 3.9% 4.1% —(1) —
(1) —
(1)
(1) Rate of compensation increase is not applicable to the retiree health benefits, as compensation levels do not impact earned benefits.
Weighted-average assumptions used to determine net periodic benefit
cost for years ended December 31:
Pension Benefits Retiree Health
2010 2009 2008 2007 2010 2009 2008 2007
Discount rate 5.7% 6.3% 5.9% 5.3% 5.4% 6.3% 6.2% 5.8%
Expected return
on plan assets 7.3% 7.4% 7.6% 7.6% —(1) —
(1) —
(1) —
(1)
Rate of compensation
increase 3.6% 3.9% 4.1% 4.1% —(2) —
(2) —
(2) —
(2)
(1) Expected return on plan assets is not applicable to retiree health benefits, as these plans are not funded.
(2) Rate of compensation increase is not applicable to retiree health benefits, as compensation levels do not impact earned benefits.
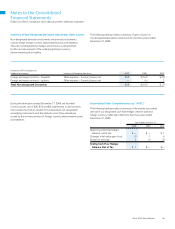
Assumed healthcare cost trend rates at December 31,
2009 2008
Health care cost trend rate assumed for
next year 9.8% 9.4%
Rate to which the cost trend rate is assumed
to decline (the ultimate trend rate) 4.9% 5.0%
Year that the rate reaches the ultimate
trend rate 2017 2013
Assumed health care cost trend rates have a significant effect on
the amounts reported for the health care plans. A one-percentage-
point change in assumed health care cost trend rates would have
the following effects:
1% Increase 1% Decrease
Effect on total service and interest
cost components $ 5 $ (4)
Effect on post-retirement
benefit obligation $ 71 $ (61)