Xerox 2009 Annual Report Download - page 78
Download and view the complete annual report
Please find page 78 of the 2009 Xerox annual report below. You can navigate through the pages in the report by either clicking on the pages listed below, or by using the keyword search tool below to find specific information within the annual report.-
 1
1 -
2
-
3
-
4
-
5
-
6
-
7
-
8
-
9
-
10
-
11
-
12
-
13
-
14
-
15
-
16
-
17
-
18
-
19
-
20
-
21
-
22
-
23
-
24
-
25
-
26
-
27
-
28
-
29
-
30
-
31
-
32
-
33
-
34
-
35
-
36
-
37
-
38
-
39
-
40
-
41
-
42
-
43
-
44
-
45
-
46
-
47
-
48
-
49
-
50
-
51
-
52
-
53
-
54
-
55
-
56
-
57
-
58
-
59
-
60
-
61
-
62
-
63
-
64
-
65
-
66
-
67
-
 68
68 -
 69
69 -
 70
70 -
 71
71 -
 72
72 -
 73
73 -
 74
74 -
 75
75 -
 76
76 -
 77
77 -
 78
78 -
 79
79 -
 80
80 -
 81
81 -
 82
82 -
 83
83 -
 84
84 -
 85
85 -
 86
86 -
 87
87 -
 88
88 -
89
-
90
-
91
-
92
-
93
-
94
-
95
-
96
 |
 |

76 Xerox 2009 Annual Report
Notes to the Consolidated
Financial Statements
Dollars in millions, except per-share data and unless otherwise indicated.
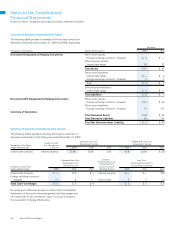
Expected Long-term Rate of Return
We employ a “building block” approach in determining the long-term
rate of return for plan assets. Historical markets are studied and long-
term relationships between equities and fixed income are assessed.
Current market factors such as inflation and interest rates are evaluated
before long-term capital market assumptions are determined. The long-
term portfolio return is established, giving consideration to investment
diversification and rebalancing. Peer data and historical returns are
reviewed periodically to assess reasonableness and appropriateness.
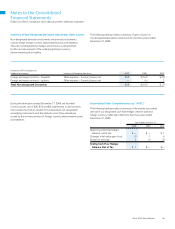
Contributions
Our 2009 contributions for our worldwide benefit plans were $122 for
pensions and $107 for our retiree health. In 2010 we expect to make
contributions of approximately $260 to our worldwide defined benefit
pension plans and $103 to our retiree health benefit plans in 2010.
Once the January 1, 2010 actuarial valuations are finalized for our
U.S. qualified pension plans, we will reassess the need for additional
contributions for these plans. No additional contributions were made in
2009, due to the ERISA funded status of our U.S. qualified pension plans
and the availability of a credit balance that had resulted from funding
in prior periods in excess of minimum requirements. In 2008, we made
additional contributions above what was disclosed in the 2007 Annual
Report of $165 to our U.S. qualified pension plans.
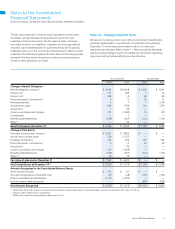
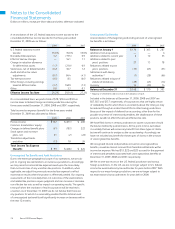
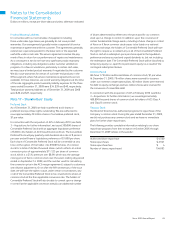
Estimated Future Benefit Payments
The following benefit payments, which reflect expected future service,
as appropriate, are expected to be paid during the following years:
Pension Retiree
Benefits Health
2010 $721 $103
2011 640 101
2012 664 100
2013 679 100
2014 677 98
Years 2015–2019 3,643 457
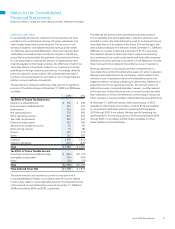
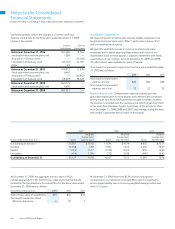
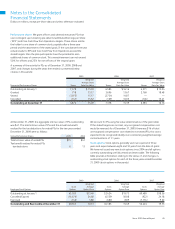
The following table represents a roll-forward of the defined benefit plan’s
assets measured using significant unobservable inputs (Level 3 assets):
Fair Value Measurement Using Significant Unobservable Inputs (Level 3)
Private Guaranteed
Equity/Venture Insurance
Hedge Funds Real Estate Capital Contracts Other Total
December 31, 2008 $ 3 $ 279 $ 331 $ 104 $ — $ 717
Net payments, purchases and sales 1 5 16 1 — 23
Net transfers in (out) — — — 16 — 16
Realized gains (losses) — — 8 3 (1) 10
Unrealized gains (losses) — (66) (69) 2 1 (132)
Currency translation — 19 — 4 — 23
December 31, 2009 $ 4 $ 237 $ 286 $ 130 $ — $ 657
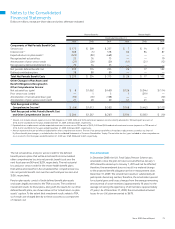
Our pension plan assets at December 31, 2009 were as follows: U.S.
$3.1 billion; U.K. $2.7 billion; Canada $0.5 billion and Other $1.3 billion.
Our benefit obligations at December 31, 2009 were as follows: U.S.
$4.4 billion; U.K. $2.7 billion; Canada $0.6 billion and Other $1.5 billion.
Investment Strategy
The target asset allocations for our worldwide plans for 2009 and
2008 were:
2009 2008
Equity investments 41% 47%
Fixed income investments 45% 42%
Real estate 7% 7%
Private equity 4% 3%
Other 3% 1%
Total Investment Strategy 100% 100%
We employ a total return investment approach whereby a mix of
equities and fixed income investments are used to maximize the long-
term return of plan assets for a prudent level of risk. The intent of this
strategy is to minimize plan expenses by exceeding the interest growth
in long-term plan liabilities. Risk tolerance is established through careful
consideration of plan liabilities, plan funded status and corporate
financial condition. This consideration involves the use of long-term
measures that address both return and risk. The investment portfolio
contains a diversified blend of equity and fixed income investments.
Furthermore, equity investments are diversified across U.S. and non-U.S.
stocks, as well as growth, value and small and large capitalizations.
Other assets such as real estate, private equity and hedge funds are
used to improve portfolio diversification. Derivatives may be used to
hedge market exposure in an efficient and timely manner; however,
derivatives may not be used to leverage the portfolio beyond the market
value of the underlying investments. Investment risks and returns are
measured and monitored on an ongoing basis through annual liability
measurements and quarterly investment portfolio reviews.