Xerox 2009 Annual Report Download - page 86
Download and view the complete annual report
Please find page 86 of the 2009 Xerox annual report below. You can navigate through the pages in the report by either clicking on the pages listed below, or by using the keyword search tool below to find specific information within the annual report.-
 1
1 -
2
-
3
-
4
-
5
-
6
-
7
-
8
-
9
-
10
-
11
-
12
-
13
-
14
-
15
-
16
-
17
-
18
-
19
-
20
-
21
-
22
-
23
-
24
-
25
-
26
-
27
-
28
-
29
-
30
-
31
-
32
-
33
-
34
-
35
-
36
-
37
-
38
-
39
-
40
-
41
-
42
-
43
-
44
-
45
-
46
-
47
-
48
-
49
-
50
-
51
-
52
-
53
-
54
-
55
-
56
-
57
-
58
-
59
-
60
-
61
-
62
-
63
-
64
-
65
-
66
-
67
-
68
-
69
-
70
-
71
-
72
-
73
-
74
-
75
-
 76
76 -
 77
77 -
 78
78 -
 79
79 -
 80
80 -
 81
81 -
 82
82 -
 83
83 -
 84
84 -
 85
85 -
 86
86 -
 87
87 -
 88
88 -
 89
89 -
 90
90 -
 91
91 -
 92
92 -
 93
93 -
 94
94 -
 95
95 -
 96
96
 |
 |
84 Xerox 2009 Annual Report
Notes to the Consolidated
Financial Statements
Dollars in millions, except per-share data and unless otherwise indicated.
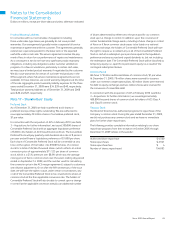
Stock-Based Compensation
We have a long-term incentive plan whereby eligible employees may
be granted restricted stock units (“RSUs”), performance shares (“PSs”)
and non-qualified stock options.
We grant PSs and RSUs in order to continue to attract and retain
employees and to better align employee interest with those of our
shareholders. Each of these awards is subject to settlement with newly
issued shares of our common stock. At December 31, 2009 and 2008,
15 million shares were available for grant of awards.
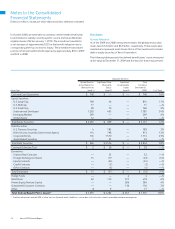
Stock-based compensation expense for the three years ended December
31, 2009 was as follows:
2009 2008 2007
Stock-based compensation
expense, pre-tax $85 $85 $89
Stock-based compensation
expense, net of tax 52 52 55
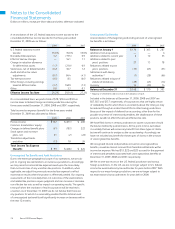
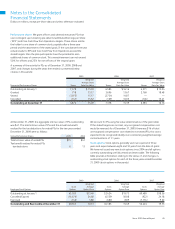
Restricted stock units: Compensation expense is based upon the
grant date market price for most awards and a Monte Carlo simulation
pricing model for a fiscal 2009 grant that included a market condition;
the expense is recorded over the vesting period, which ranges from three
to five years from the date of grant. A summary of the activity for RSUs
as of December 31, 2009, 2008 and 2007, and changes during the years
then ended, is presented below (shares in thousands):
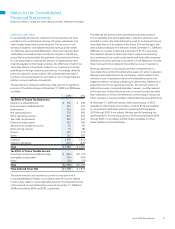
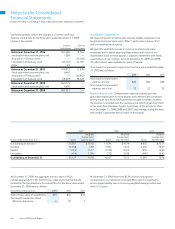
The following table reflects the changes in Common stock and
Treasury stock shares for the three years ended December 31, 2009
(shares in thousands):
Common Treasury
Stock Shares Stock Shares
Balance at December 31, 2006 954,568 (8,363)
Stock option and incentive plans, net 7,588 —
Acquisition of Treasury stock — (36,638)
Cancellation of Treasury stock (43,165) 43,165
Other 22 —
Balance at December 31, 2007 919,013 (1,836)
Stock option and incentive plans, net 4,442 —
Acquisition of Treasury stock — (56,842)
Cancellation of Treasury stock (58,678) 58,678
Balance at December 31, 2008 864,777 —
Stock option and incentive plans, net 4,604 —
Balance at December 31, 2009 869,381 —
At December 31, 2009, there was $129 of total unrecognized
compensation cost related to nonvested RSUs, which is expected to
be recognized ratably over a remaining weighted-average contractual
term of 1.9 years.
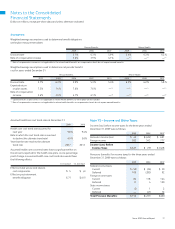
At December 31, 2009, the aggregate intrinsic value of RSUs
outstanding was $213. The total intrinsic value and actual tax benefit
realized for the tax deductions for vested RSUs for the three years ended
December 31, 2009 were as follows:
Vested Restricted Stock Units 2009 2008 2007
Total intrinsic value of vested RSUs $19 $54 $16
Tax benefit realized for vested
RSUs tax deductions 6 18 3
2009 2008 2007
Weighted Weighted Weighted
Average Grant Average Grant Average Grant
Nonvested Restricted Stock Units Shares Date Fair Value Shares Date Fair Value Shares Date Fair Value
Outstanding at January 1 14,037 $ 15.43 11,696 $ 16.78 8,635 $ 15.71
Granted 15,268 6.69 5,923 13.63 4,444 18.17
Vested (3,764) 15.17 (3,350) 16.92 (935) 13.65
Cancelled (414) 13.94 (232) 15.98 (448) 16.42
Outstanding at December 31 25,127 10.18 14,037 15.43 11,696 16.78